
What the Mag 7 Selloff Actually Means for Ad Revenue
The June 2026 Mag 7 selloff erased $2.3 trillion in market cap, but Google and Meta's ad revenue grew 14.5% and 33%, respectively. This article explains why the stock decline is disconnected from ad-platform fundamentals and what signals media buyers should track instead.
- Platform
- Google Ads
- Campaign type
- Performance Max
- Spend range
- Enterprise
- Timeframe
- Q0 2026
- ROAS
- 0%
- Verdict
- win
- Last reviewed
- 0-07-25
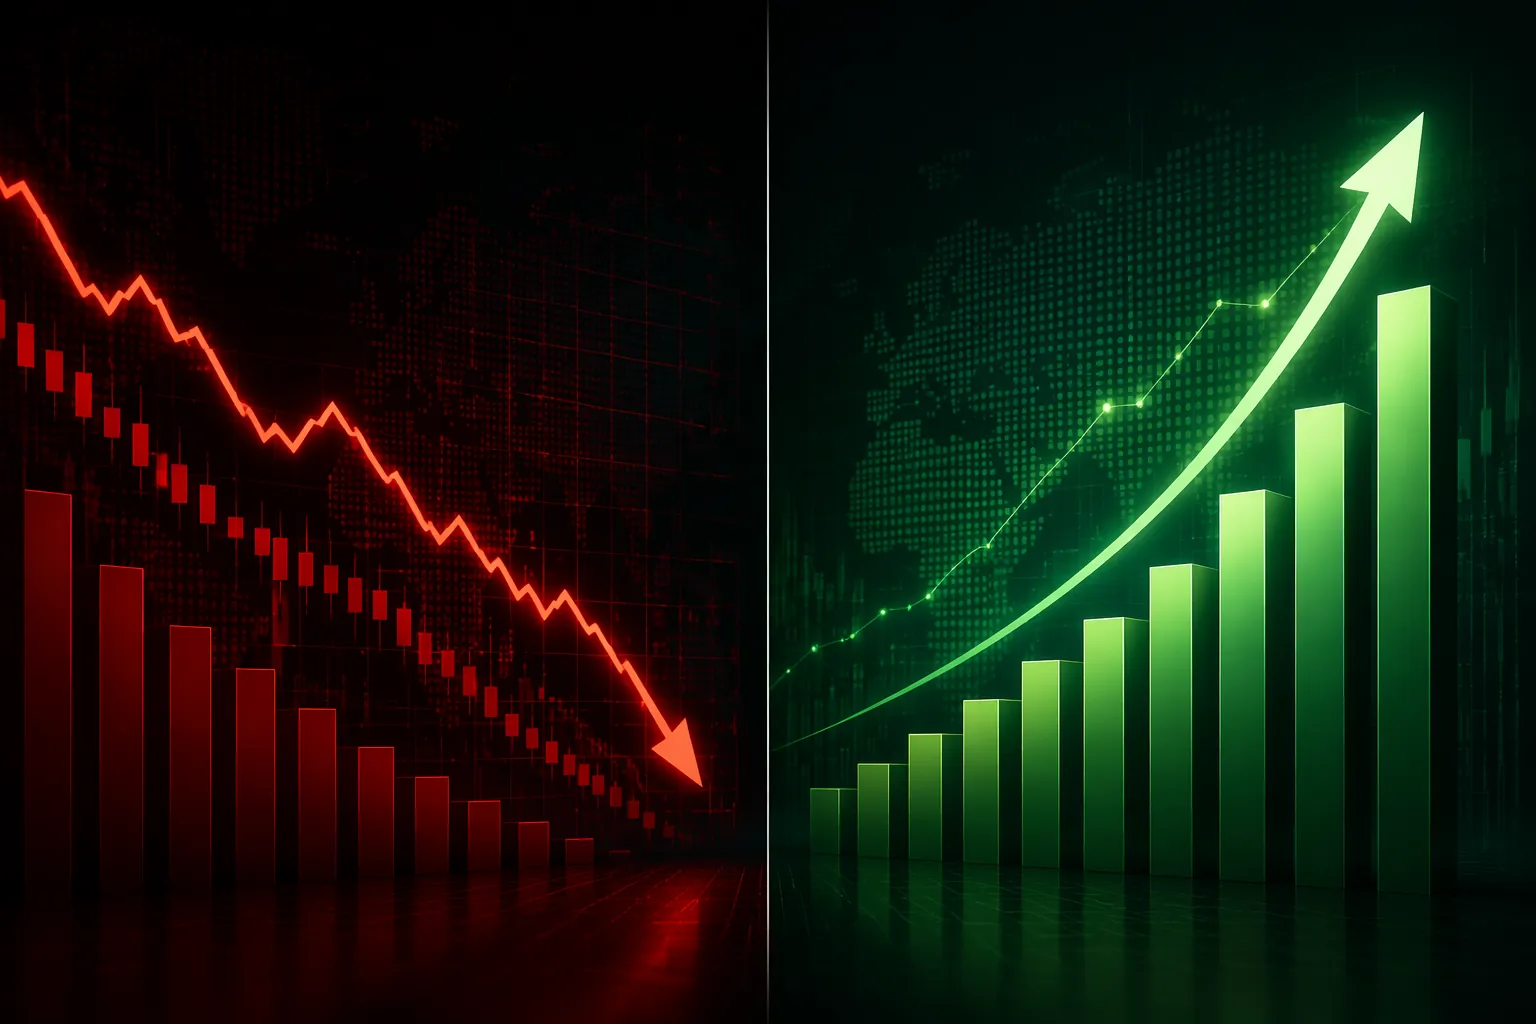
The June 2026 Mag 7 selloff and the ad-platform revenue data are pointing in different directions. The stock headline says investors erased $2.3 trillion in market value from the group. The operating data says Google’s ad business still grew 14.5% in Q2 2026, while Meta’s ad revenue grew 33% in its most recently reported quarter, Q1 2026.[1][2]
| Signal | What it says | What it does not say |
|---|---|---|
| Mag 7 market cap | The group lost $2.3 trillion in June 2026.[1] | That advertisers cut Google or Meta budgets. |
| Google ads | Google ad revenue grew 14.5% in Q2 2026; Search ad revenue grew 17% to $63.3 billion.[1][3] | That every Google Ads account should expect cheaper auctions. |
| Meta ads | Meta ad revenue grew 33% to $55 billion in Q1 2026, with impressions up 19% and price per ad up 12%.[2] | That Meta’s Q2 2026 result is already confirmed. |
That is the useful starting point for media buyers trying to judge whether the Mag 7 stock decline affects Google or Meta ad revenue. A stock drawdown is not a media-buying instruction. It can become relevant if it forces product changes, margin pressure, auction behavior changes, or budget-side weakness. But the June signal did not start as evidence that advertisers were walking away from Google Search or Meta’s feed, Reels, and broader placement system.
The Selloff Was About AI Spending First
The cleaner explanation is that investors were reacting to the cash cost of the AI buildout. Apollo Global’s Torsten Slok documented a collapse in free cash flow at four of the seven Mag 7 companies from their 2024 peak into 2026, framing the pressure as an AI infrastructure and free-cash-flow problem rather than an ad-demand collapse.[4]
That distinction matters because media buyers inherit the second-order effects, not the market-cap number itself. If AI infrastructure spending keeps consuming cash, the question becomes whether platforms raise monetization pressure, push automation defaults harder, change fee structures, or concentrate spend into their owned inventory. Those are campaign-relevant effects. A red day in a market-cap chart is not.
The broader AI-capex question is worth tracking, but it needs to be verified through operating signals rather than assumed from investor fear. That is the same separation used in the broader capex-vs-ad-spend framework in How AI Capex Drives Digital Ad Spend — and What You Can Verify. Infrastructure cost can eventually show up in ad products, but the transmission path has to be observed.
Google: The Ad Line Is Still Growing, but the Watch Points Are Real
Google’s Q2 2026 ad result does not look like an advertiser retreat. Search ad revenue grew 17% to $63.3 billion, and broader Google ad revenue grew 14.5%.[1][3] For campaign teams, that is still a demand-positive platform signal.
The reason Google deserves the deeper risk read is not that its stock sold off. It is that several operating signals now sit close to the ads business. Search growth slowed from 19% in Q1 to 17% in Q2, the first slowdown after four quarters of acceleration, and CFO Anat Ashkenazi warned that Q3 “will begin lapping an acceleration.”[3] That is not a crisis. It is a reminder not to turn one strong Search quarter into a straight-line forecast.
The cash-flow side is more uncomfortable. Alphabet reported negative free cash flow of $5.9 billion in Q2 2026, while long-term debt rose to $98.2 billion from about $16 billion.[1] That does not mean Google Ads auctions automatically get more expensive next week. It does mean the platform has a stronger incentive to protect monetization while funding the AI buildout.
The product-default changes are where that incentive becomes more practical for buyers. Google had 500,000 advertisers using AI Max, and Dynamic Search Ads are being retired in September 2026.[3] Those are not just product notes; they change how much query discovery, creative assembly, and targeting logic sits inside Google’s automation layer. If a client asks whether the selloff should change spend, the better answer is to audit where automation is already changing traffic quality, query coverage, and marginal CPA.
Revenue mix adds another watch point. Google owned-property revenue reached 90% for the first time, according to PPC.Land’s coverage of the revenue shift.[5] A higher owned-property concentration can be healthy for Google’s margins, but it also makes inventory mix and platform-controlled surfaces more important to account-level analysis. Buyers should be watching search terms, placement expansion, Performance Max asset and channel reporting, and incrementality tests more closely than the Nasdaq chart.
The chip and data-center cost story can still matter here. If infrastructure costs keep rising, ad platforms have more reason to steer advertisers toward products that preserve scale and yield. That is the practical version of the concern discussed in Does AI Chip Spending Improve Ad Results or Just Lock You In? and Intel's AI Data Center Growth Signals Higher Ad Platform Costs. The account question is not whether AI spending is large. It is whether the platform response changes the cost or quality of the next conversion.
Meta Is the Stronger Ad-Demand Counterexample, With One Date Missing
Meta’s most recent actuals make it difficult to argue that the June Mag 7 selloff was already showing up as weak advertiser demand. In Q1 2026, Meta ad revenue grew 33% to $55 billion. Impressions rose 19%, and price per ad rose 12%.[2] That combination is the part buyers should not rush past: more ads were delivered, and the average price rose at the same time.
That is materially different from a platform growing only because it stuffed more impressions into weaker pricing. Meta’s Q1 result showed volume and pricing strength together. It also reported 8 million advertisers using AI creative tools, which suggests adoption of automated creative workflows was already broad before the June selloff headlines arrived.[2]
There are still account-level reasons to watch Meta closely. EU location fees took effect July 1, 2026, at rates of 2% to 5%, according to PPC.Land’s coverage.[6] For advertisers exposed to those markets, that is more actionable than the Mag 7 market-cap number because it can affect the actual cost structure of serving campaigns in specific locations.
The big constraint is timing. Meta’s Q2 2026 earnings are due July 29, 2026, so as of July 25, 2026, Q1 is the latest confirmed Meta result.[2] Treating the April 2026 eMarketer projection that Meta will overtake Google in 2026 worldwide net ad revenue as if it already happened would be the same category error as treating a stock selloff as campaign data. It is a forecast: eMarketer projected Meta at $243.5 billion and Google at $239.5 billion in 2026 worldwide net ad revenue, after 2025 actuals of $196.17 billion for Meta and $214.06 billion for Google.[7]
Ad Checks Did Not Confirm a Q2 Pullback
Independent channel checks also keep the June selloff in the capital-market box for now. Bernstein and Wolfe Research checks in July 2026 found resilient digital ad demand and did not detect a recession pullback in Q2, according to Search Engine Journal’s coverage.[8] That is not proof that every vertical is healthy. It is a useful guardrail against converting investor anxiety into a blanket media-plan cut.
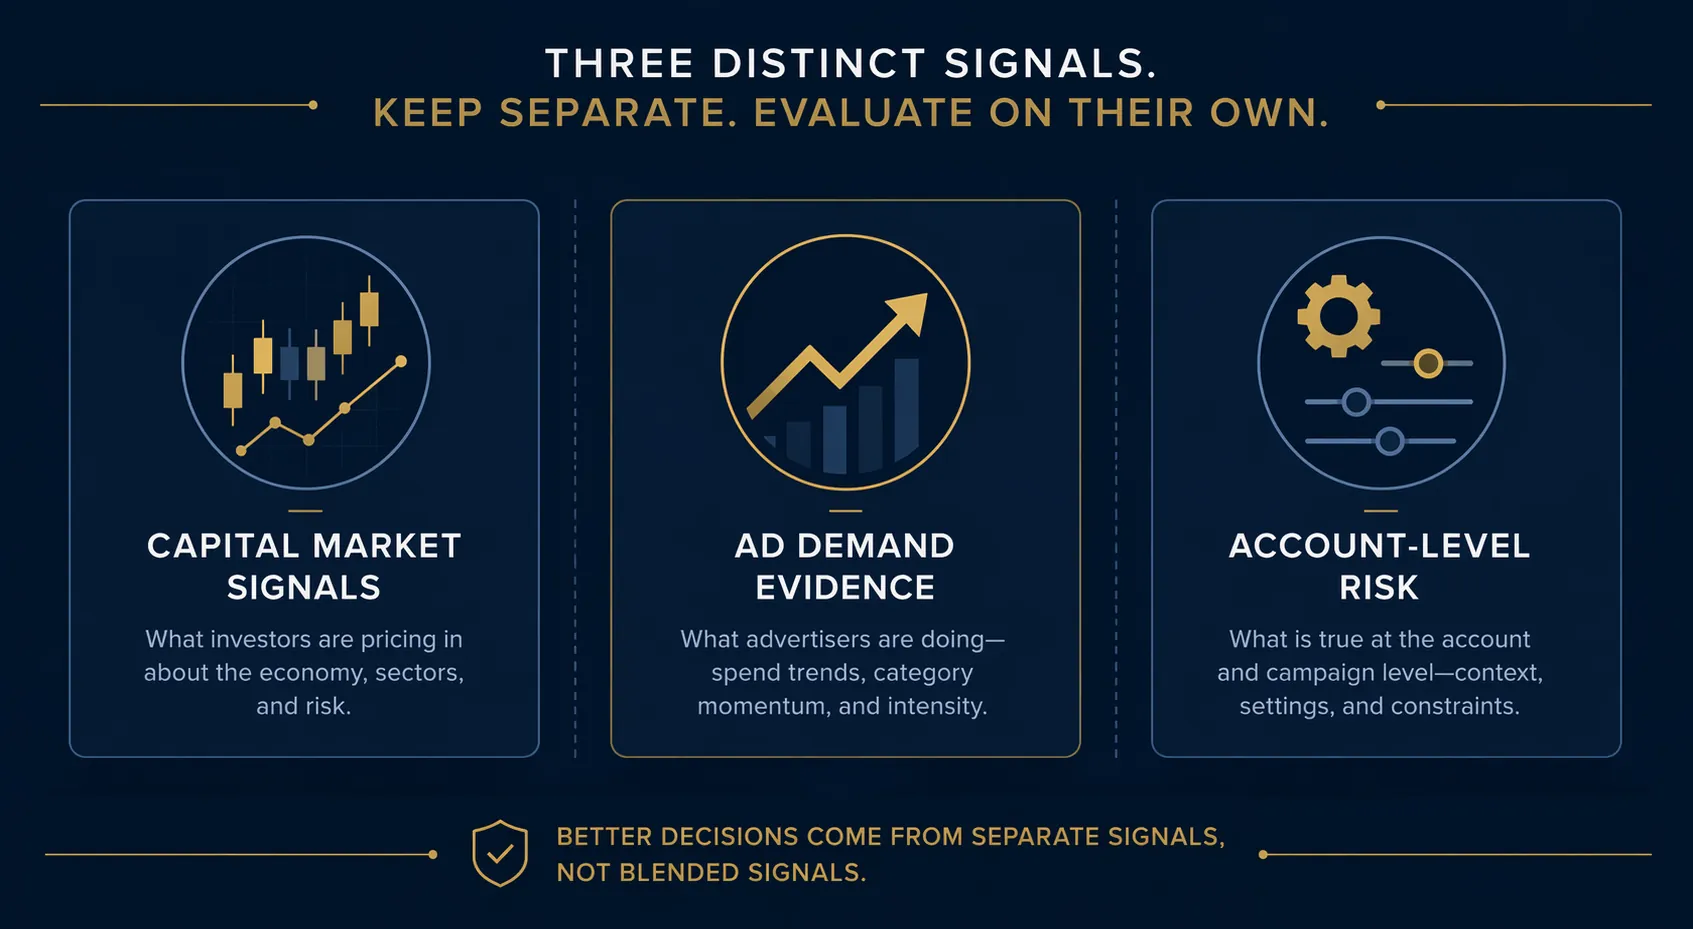
The operating split is simple enough to keep on one screen: stock-market concern belongs with free cash flow, debt, capex, and investor risk appetite; ad-demand evidence belongs with platform revenue, advertiser activity, impressions, and price per ad; account-level risk belongs with CPA, ROAS, conversion quality, auction overlap, fees, product defaults, and measurement drift.
What Would Justify Changing Campaign Behavior
A campaign change needs a campaign-relevant trigger. The June selloff, by itself, does not clear that bar. The better watchlist is narrower and more useful:
- Google free cash flow and debt: watch whether AI infrastructure spending keeps pressuring cash generation and whether monetization pressure shows up in product behavior.
- Google Search growth: watch whether Q3 confirms the CFO’s warning about lapping faster growth, and whether Search demand decelerates without an account-level quality offset.
- Automation defaults: watch AI Max adoption, the September 2026 Dynamic Search Ads retirement, and any loss of practical control over query matching, creative assembly, or traffic mix.
- Meta Q2 earnings: wait for July 29 before updating the Meta side of the call; Q1 was strong, but Q2 is not banked yet.
- Market-specific fees: isolate EU location-fee exposure from broader Meta performance so a regional cost change does not get misread as platform-wide weakness.
Infrastructure risk also deserves a place on the watchlist, but not as a reason to panic-pause campaigns. Data-center power constraints, grid costs, and local regulation can feed into the long-run cost of AI-heavy ad systems. That is the mechanism explored in PJM's data center crisis is making your AI ads more expensive and How Hochul's Data Center Moratorium Impacts AI Ad Performance. For this specific June selloff, though, the account-facing evidence still has to come through platform reporting and campaign economics.

So the working read is disciplined, not comforting. Treat the June Mag 7 selloff as a capital-market reaction to AI infrastructure spending and free-cash-flow fear. Keep current Google and Meta campaigns judged by account data and platform operating signals. Give Google the closer risk review because its cash-flow pressure, Search deceleration, product-default shifts, and owned-property concentration are already visible. Keep Meta in the stronger ad-demand column for now, but do not update the Q2 view until the July 29 earnings release arrives.
References
- CNBC coverage of Mag 7 selloff and Alphabet Q2 earnings live updates, CNBC, June 30-July 1, 2026.
- Meta Q1 earnings coverage, PPC.Land.
- Google Search revenue deceleration analysis, Search Engine Journal.
- Free cash flow analysis of the Magnificent Seven, Apollo Global, 2026.
- Google revenue-shift milestone coverage, PPC.Land.
- EU location fee details, PPC.Land.
- Meta to overtake Google in global ad revenue this year, forecast says, Reuters, April 13, 2026.
- July 2026 digital ad channel checks coverage, Search Engine Journal, July 2026.
Built on this evidence
No Bidding tactic or Creative record currently cites this case file. Compare it against other results in Benchmarks.
Related benchmark reading
Report a corroborating or contradicting result
Seeing something different in your own account? Feed the data-integrity loop instead of leaving an open comment.