
What Meta Outages Actually Cost Advertisers by Spend Tier
This article models the real cost of Meta ad outages across spend tiers, factoring in lost ad exposure, algorithm recovery, and hidden attribution scrambling — so advertisers can quantify their risk exposure and justify contingency budgets.
- Platform
- Meta Ads
- Campaign type
- Social Media
- Spend range
- $0/day
- Timeframe
- October 0 - March 2026
- ROAS
- 0
- Verdict
- loss
- Last reviewed
- 0-07-25
The visible effect of a Facebook or Instagram outage on paid ads is usually the cheapest part of the incident. If an account spends $500 a day, a two-hour delivery outage only puts about $42 of scheduled media exposure at risk. That is annoying, but it is not what derails the Monday pacing meeting. The harder bill comes after the platform is back: unstable delivery, learning-phase disruption, CPM movement, delayed attribution, and a reporting window that makes perfectly reasonable budget decisions look either too cautious or too aggressive.
That distinction matters more now because Meta outage risk is no longer a once-a-year exception in the paid-social calendar. AdStatus Monitor documented more than 60 Meta ad platform incidents from October 2024 through March 2026, with incident frequency rising 316% from roughly 1.8 per month in early 2025 to about 7.5 per month in late 2025; 53% of the documented incidents directly affected ad delivery.[1]
The spend-tier model
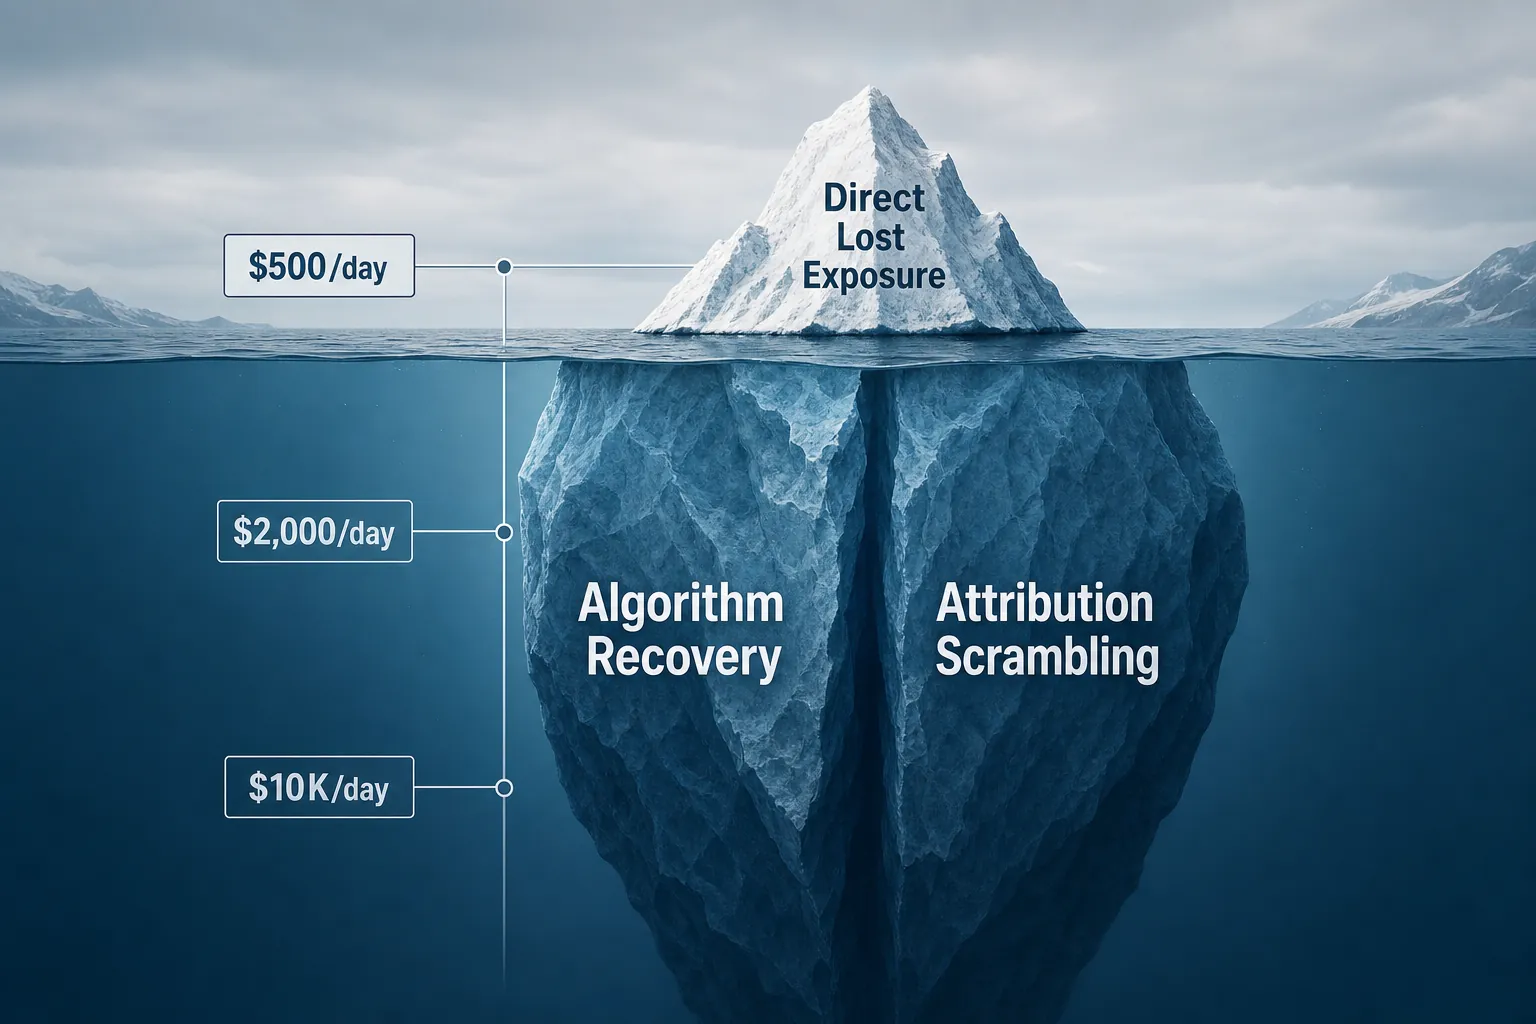
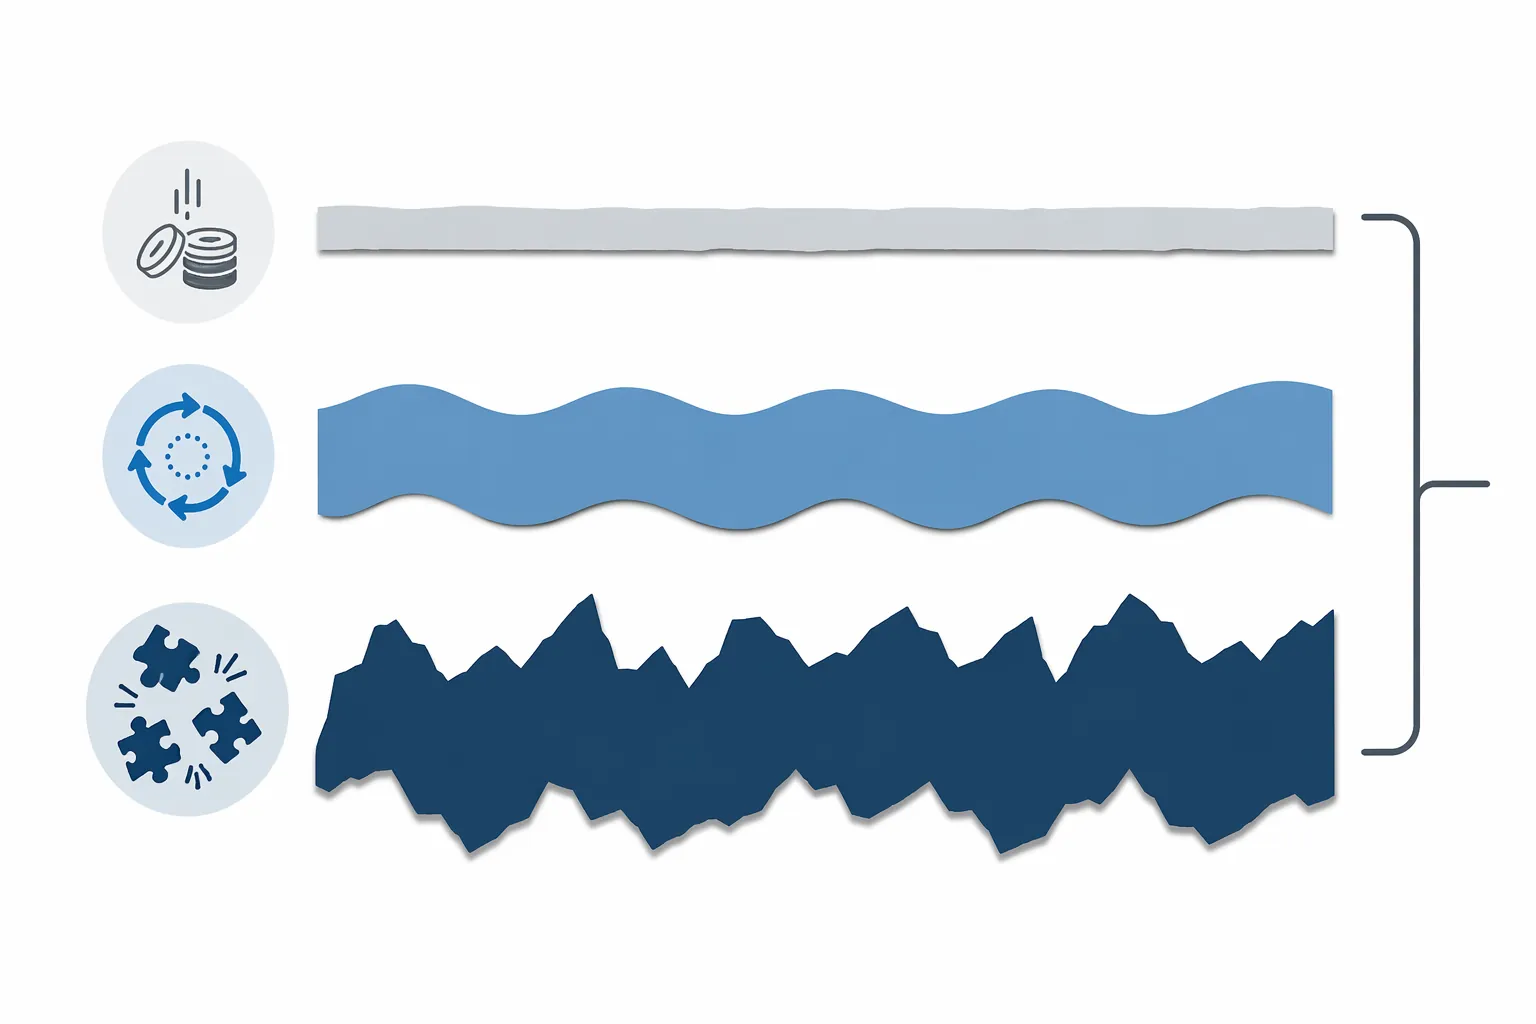
The cleanest way to price the risk is to separate outage cost into three layers: direct lost exposure during downtime, modeled algorithm recovery cost after service returns, and attribution scrambling that affects measurement and decisions. Only the first layer is simple arithmetic. The second and third are where most budget conversations get lazy.
| Daily Meta spend | Scenario | Direct lost exposure | Modeled recovery / total impact | Boundary |
|---|---|---|---|---|
| $500/day | 2-hour outage | ~$42 | ~$1,500-$2,500 modeled algorithm recovery | Modeled estimate, not verified advertiser loss |
| $2,000/day | 2-hour outage | ~$167 | ~$6,000-$10,000 modeled algorithm recovery | Modeled estimate, not verified advertiser loss |
| $10,000/day | 6-hour outage | ~$2,500 scheduled spend exposure by time, while AdStatus models ~$30,000-$40,000 total impact | Assumes 5x ROAS and 24-48h recovery; modeled estimate, not verified advertiser loss |
Those numbers should not be read as audited loss statements. They are modeled estimates using a specific outage-impact methodology, and the model is only as good as its assumptions about ROAS, recovery time, and how badly delivery destabilizes after the outage. That caveat is not a reason to ignore the model. It is the reason to show the assumptions next to the number instead of letting every outage become a vague footnote called platform volatility.
The June 12, 2026 incident is useful because it shows why advertisers should not isolate Ads Manager from the rest of Meta's operating surface. Reports that day described disruption across Facebook, Instagram, Messenger, Ads Manager, Messenger API, WhatsApp Business Platform, and Graph API, with more than 100,000 user reports attached to the broader outage.[2] Business Insider also reported that Facebook, Instagram, and Messenger were coming back online after the disruption.[3] For paid media, the important part is not the user-report count. It is that delivery, campaign management, messaging, and API-dependent workflows can all become questionable at the same time.
Layer 1: direct lost exposure is the small, defensible number
Direct exposure is the line item everyone can calculate without a debate. Take the daily budget, divide by 24, multiply by the outage window. A $500/day account has about $20.83 of scheduled hourly spend, so a two-hour outage exposes about $41.67. A $2,000/day account exposes about $166.67 over the same window. If a $10,000/day account is down for six hours, the time-based exposure is about $2,500.
This is the number finance teams tend to understand first, and it is still worth putting in the incident note. It answers a narrow question: how much scheduled delivery could not happen while the platform was impaired? It does not answer whether Meta later tried to catch up, whether the catch-up spend happened in worse auctions, whether the learning system had to re-stabilize, or whether conversion reporting became unreliable for the next budget decision.
That is why direct exposure should be treated as the floor, not the invoice. On smaller accounts, the direct exposure can look too minor to matter. On larger accounts, it finally becomes a material number, but it still understates the operational problem.
Layer 2: algorithm recovery is where the model gets expensive
Ad delivery systems do not simply resume from the last clean minute like a paused video. A disruption can change pacing, available conversion signals, auction participation, budget consumption, and the system's confidence in which audiences and creatives are most likely to convert. AdStatus Monitor's impact model uses 24-48 hours of degraded delivery as the recovery window behind its spend-tier estimates.[1]
That is the part that makes a $42 direct-exposure event on a $500/day account turn into a modeled $1,500-$2,500 recovery problem. It is not claiming the advertiser literally lost $2,500 during the outage window. It is modeling the business impact of a disrupted optimization system after the outage, when spend may resume but performance quality is no longer behaving like the pre-outage baseline.
For a $2,000/day account, the same model puts recovery at roughly $6,000-$10,000 after a two-hour outage.[1] That range is large because the account's pre-outage economics matter. A broad prospecting account with stable conversion volume may absorb disruption differently from a smaller lead-gen account with fewer daily conversions and tighter learning constraints. The spend tier tells you the exposure size; it does not tell you how fragile the account is.
SureBright has described Meta advertisers dealing with CPM volatility and destabilized delivery during the platform's broader 2026 performance turbulence, and Digital Applied separately covered March 2026 algorithm disruption and learning-phase issues.[5][6] Those accounts are not proof that every outage causes the same recovery pattern. They do support the narrower operating point: once optimization becomes unstable, the cost is measured over the recovery period, not just the minutes when Ads Manager is unavailable.
The useful internal question is therefore not, “How long was Meta down?” It is, “How many delivery cycles do we need before we trust the account again?” If your team normally judges creative tests, budget increases, or bid changes on a one-day view, a 24-48 hour recovery assumption forces you to mark that window as contaminated instead of treating it as normal performance evidence.
Layer 3: attribution scrambling turns a delivery problem into a decision problem
Attribution scrambling is harder to price because it does not always show up as a clean media-cost variance. It shows up as delayed conversions, broken or late API signals, mismatched platform and backend reporting, and an awkward question from someone outside the ad account: did performance actually drop, or did the measurement path break?
This matters most when the outage touches more than ad delivery. The June 12 incident reportedly affected Ads Manager, Messenger API, WhatsApp Business Platform, and Graph API along with consumer-facing Meta properties.[2] If a campaign depends on lead forms, messaging flows, server-side events, catalog updates, or API-connected reporting, the paid-social operator is not only checking whether spend resumed. They are checking whether the post-click system still captured enough truth to make the next call.
The cost here is decision quality. A buyer may pause a campaign that looks inefficient because conversions are late. A manager may approve a budget cut because blended revenue appears soft. A test may be declared a loser because the outage window sat inside the readout period. None of those mistakes require the outage to last very long. They require the team to treat polluted data as clean.
For lower-to-mid spend accounts, this is usually where the internal argument gets messy. The direct-loss math is too small to defend a contingency budget by itself. The recovery model is more realistic, but still assumption-heavy. Attribution scrambling is the bridge between those two: it explains why the team needs a documented outage flag, a recovery window, and a rule for excluding affected periods from performance readouts.
How the same outage scales by spend tier
A small account and a larger account do not experience the same outage with the same kind of pain. The small account may not lose much scheduled spend, but it may lose enough conversion signal to make optimization choppy. The larger account may keep enough volume to recover faster statistically, but each bad recovery hour carries more dollars. Spend tier changes the shape of the problem.
| Monthly spend profile | What usually matters most | How to explain the outage cost |
|---|---|---|
| About $500/day, or roughly $15,000/month | Learning disruption can outweigh direct lost media by a wide margin | Use direct lost exposure as the floor and modeled recovery as the planning number |
| About $2,000/day, or roughly $60,000/month | Recovery-window performance can distort weekly pacing and budget decisions | Separate outage-window spend from the following 24-48 hours before judging efficiency |
| About $10,000/day, or roughly $300,000/month | Short outages can become material if catch-up delivery and ROAS assumptions move together | Model total impact under explicit ROAS and recovery assumptions; do not present it as verified loss |
The $10,000/day example is where precision matters most. AdStatus Monitor's methodology estimates a $30,000-$40,000 total impact for a six-hour outage at that spend level, assuming 5x ROAS and a 24-48 hour algorithm recovery period.[1] That is not the same as saying the outage burned $40,000 of media. It is a modeled business-impact range that combines interrupted delivery, impaired recovery, and revenue assumptions.
For mid-market accounts, I would rather see a range with assumptions than a confident single number. A clean number looks good in a slide and then collapses under the first stakeholder question. A range lets the team say: if recovery takes one day, here is the exposure; if it takes two days, here is the exposure; if we assume lower ROAS, here is the conservative case.
What belongs in an outage note
A usable outage note should be boring enough that finance trusts it and specific enough that the media team can act on it later. It does not need a dramatic postmortem. It needs the same fields every time.
- Incident window: when the team first observed the issue, when third-party or media reports confirmed it, and when normal operations appeared to resume.
- Affected surfaces: Ads Manager, Facebook, Instagram, Messenger, WhatsApp Business Platform, Graph API, pixel or CAPI reporting, catalog, lead forms, or other workflows.
- Direct exposure: daily spend divided by 24, multiplied by the estimated outage hours.
- Recovery assumption: whether the account should be monitored for 24 hours, 48 hours, or another window based on delivery stability and conversion volume.
- Reporting treatment: whether the outage window and recovery window are excluded, footnoted, or separated in pacing and test readouts.
This is also where teams should avoid over-claiming. If the account missed target CPA during the recovery period, the outage may be a plausible contributor. It is not automatically the only cause. Creative fatigue, auction shifts, budget edits, site issues, and seasonality still exist. The outage note should make the affected data visible, not turn every bad day into platform blame.
Why refunds should not be the contingency plan
The compensation side is not where advertisers should expect much relief. Meta does not offer automatic credits or refunds for downtime, and reported dispute paths generally treat irregular spending claims case by case rather than as a standing outage-credit process.[7] Vibemyad also cites self-reported budget-overage cases, but those dollar amounts are not independently verified by Meta, so they should be treated as anecdotal warnings rather than benchmark data.[7]
The enterprise comparison is uncomfortable but useful. Google Ads has an enterprise-level 99.9% uptime commitment for advertising products, while Meta does not publish a comparable public SLA for advertisers.[1] That does not mean every small advertiser receives the same protection across platforms, and the exact scope of Google's enterprise commitment should not be casually generalized. It does mean Meta buyers should not build their risk plan around an automatic make-good that does not exist.
The infrastructure context is a planning input, not the whole argument
There is a broader operating context behind the reliability discussion. SureBright reported that Meta's May 2026 layoffs affected about 8,000 employees, or roughly 10% of the workforce, with engineering hit disproportionately, while AI capital expenditure was described in the $125 billion-$145 billion range and more than double 2025 levels.[5] The same source, citing Blind and CNBC, reported employee morale down 25% from a Q2 2024 peak and a 39% decline in culture rating; because Blind is based on anonymous workplace surveys, self-selection bias applies.[5]
Inc. framed the issue through two Meta outages in 11 days and the concentration risk that creates for businesses dependent on the platform.[4] That framing is fair as far as it goes, but the media-buying question is narrower: what number should sit in the budget model when a core acquisition channel has recurring delivery and measurement interruptions?
Layoffs, AI buildout, and morale data do not prove that any specific ad account lost money during a specific incident. They do help explain why contingency planning is reasonable. When the platform has documented incident frequency, no automatic refund mechanism, and a public product roadmap dominated by massive AI investment, advertisers do not need to diagnose Meta's infrastructure to protect their own budget assumptions.
What the model can and cannot prove
The model can give a paid-social team a repeatable way to price outage exposure. It can show why the direct lost-media number is too low. It can create a defensible recovery range by spend tier. It can also force stakeholders to separate clean performance data from outage-contaminated data.
The model cannot prove exact advertiser losses. AdStatus Monitor's 60-plus incident count covers October 2024 through March 2026 from a single tracker, and April-July 2026 incidents depend on news reports and other public observations that may be incomplete.[1] The 316% increase is also one tracker's methodology, not a platform-published reliability metric.[1]
It also cannot tell every account to diversify in the same way. A $500/day account with strong email capture, clean backend reporting, and flexible pacing has a different risk profile from a $2,000/day account running high-pressure lead volume with same-day sales follow-up. A $10,000/day account may have more channel options, but it also has more dollars exposed during unstable recovery periods.
The right use is budget language. Direct lost exposure is the minimum. Modeled recovery cost is the planning range. Attribution scrambling is the reason affected windows should be flagged before anyone makes a budget, creative, or bid decision from them.
The practical budget assumption
Meta can still be an exceptional acquisition engine when delivery and measurement are working. The point of pricing outage risk is not to panic or declare the channel unusable. It is to stop treating platform downtime as weather while treating a 10% creative-test variance as finance-grade evidence.
For lower-to-mid spend accounts, the practical assumption is simple: every material Meta outage should carry a direct-exposure estimate, a 24-48 hour recovery watch, and a reporting flag for attribution contamination. If the account is large enough or the business depends heavily on Meta for acquisition volume, that modeled total outage cost should feed a contingency budget or platform-risk reserve.
The data in this article is current as of July 25, 2026. Incidents after that cutoff are not included.
References
- Meta Ads Status & Reliability Guide, AdStatus Monitor
- Facebook Down for 100,000-Plus Users, TechTimes, June 12, 2026
- Meta Says Instagram and Facebook Are 'Coming Back' Online, Business Insider
- Meta Went Down Twice in 11 Days, Inc.
- How Meta's $145 billion experiment affecting your ad performance, SureBright
- Why Meta Ads Performance Dropped in March 2026, Digital Applied
- Meta Ads Down Again? Here's How to Protect Your Budget, Vibemyad
Built on this evidence
No Bidding tactic or Creative record currently cites this case file. Compare it against other results in Benchmarks.
Related benchmark reading
Report a corroborating or contradicting result
Seeing something different in your own account? Feed the data-integrity loop instead of leaving an open comment.