
PJM's data center crisis is making your AI ads more expensive
PJM's grid shortfall is driving up inference compute costs for AI ad platforms, and those costs are being passed through to advertisers in rising CPMs and CPA. This article shows what account-level signals—like ACOS divergence and geographic drift—can confirm whether your rising costs are PJM-driven.
- Platform
- Meta Ads
- Campaign type
- Advantage+ Shopping
- Spend range
- Various
- Timeframe
- Q0 2026
- ROAS
- 0
- Verdict
- loss
- Last reviewed
- 0-07-25
The uncomfortable version of PJM’s data-center effect on AI advertising does not start with a power-market chart. It starts inside an ad account where CPMs are up, ACOS is drifting the wrong way, platform-reported ROAS still looks presentable, and finance is asking why new-customer CAC looks nothing like the dashboard export.
That pattern is no longer just a bad-week auction story. OVRDRV, citing a Haus 640-test study and a 55,000-campaign Meta analysis, reported that Advantage+ new-customer CAC doubled from $257 to $528 while reported ROAS held steady at $4.52.[1] That is the kind of split that matters more to a media buyer than another abstract warning that AI is expensive. The platform metric can remain calm while the business metric breaks.
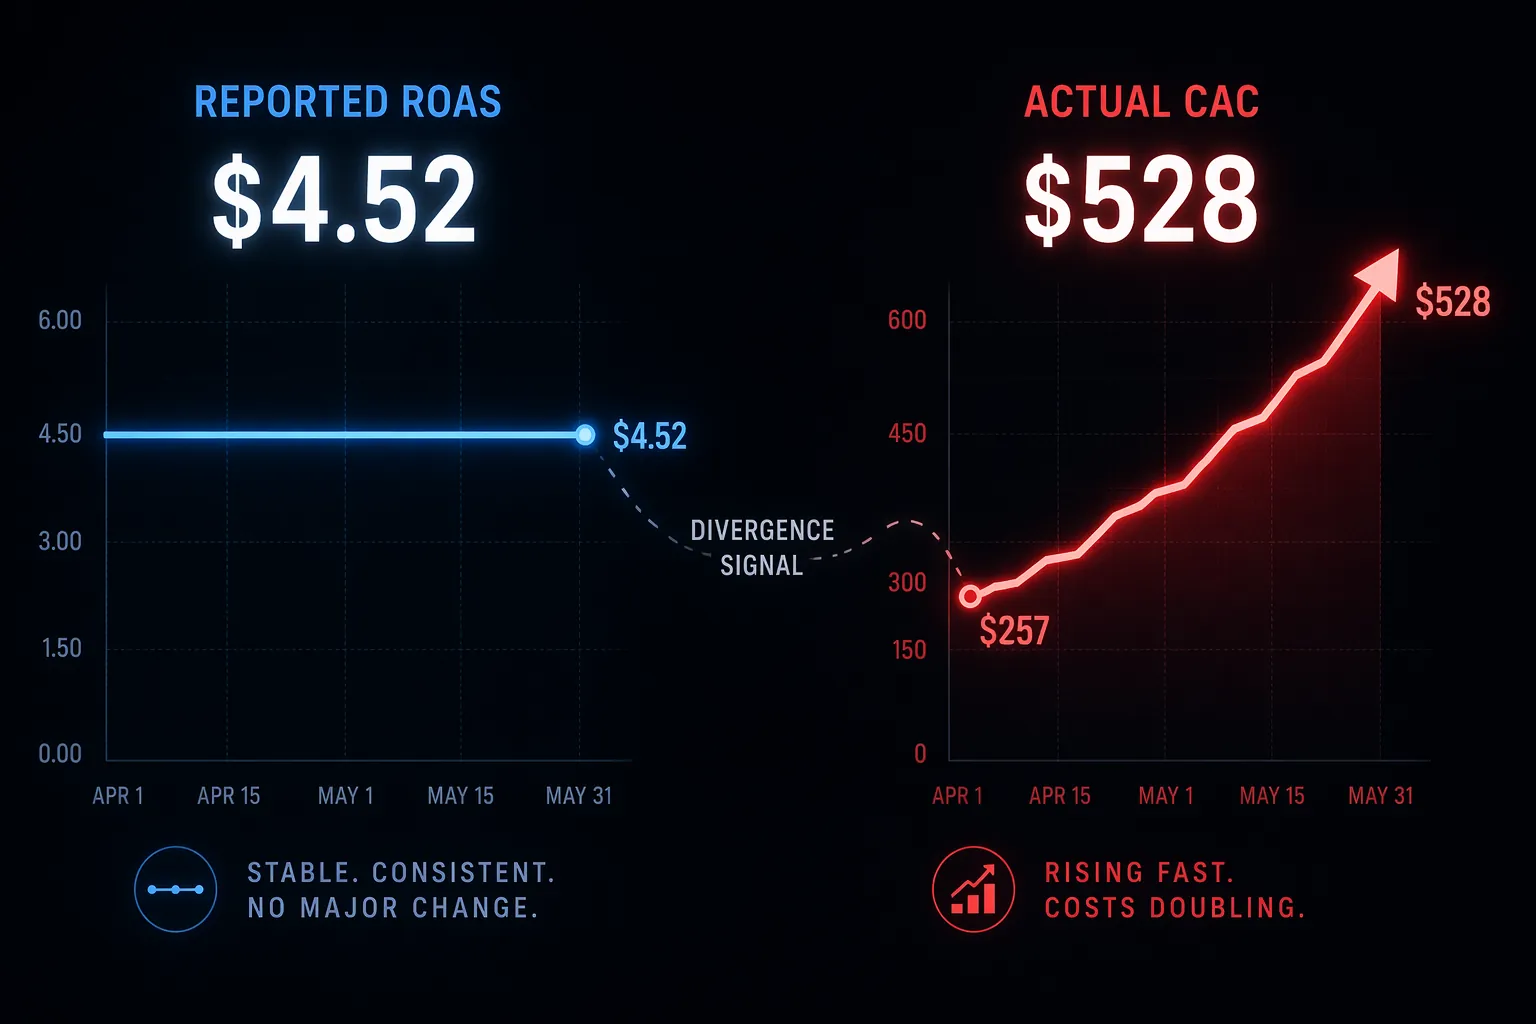
The evidence does not prove that PJM alone caused that Meta divergence. It does make one thing hard to ignore in Q3 2026: AI ad delivery now depends on a growing layer of inference compute, and the infrastructure behind that compute is under pressure in the same regions where data-center load is colliding with grid capacity. If the platform absorbs higher compute costs, margin compresses. If it passes some of those costs through auction mechanics, advertisers see it as higher CPM, CPA, or ACOS. The tricky part is that the pass-through does not need to announce itself inside reported ROAS.
The account symptom: stable ROAS, worsening economics
Reported ROAS is a platform-side ratio. It is useful, but it is not a full profit-and-loss statement. It can stay flat when the platform finds enough attributed revenue to defend the ratio, even as it does that by spending more aggressively, reallocating toward warmer users, taking more credit for conversions that would have happened anyway, or shifting the mix away from the customers the business actually needs.
That is why the OVRDRV/Haus divergence is the most important material here. The headline is not simply that Meta became more expensive. The headline is that the advertiser-facing performance layer showed a stable $4.52 reported ROAS while new-customer CAC moved from $257 to $528.[1] A buyer can lose the argument in the weekly dashboard and still be right in the finance reconciliation.
For Performance Max, Advantage+, and similar automated systems, the comparable warning sign is not one isolated CPM spike. It is the combination: ACOS rises, blended CAC rises, incrementality weakens, and platform-reported ROAS or CPA does not deteriorate at the same speed. That is where hidden cost pass-through becomes plausible enough to investigate.
What PJM actually adds to the story
PJM matters because it is not a vague “electricity is expensive” backdrop. It is the grid operator for a large US region that includes major data-center markets, and its capacity market is now reflecting the strain from data-center demand. Utility Dive reported that data centers drove $6.3 billion in PJM capacity auction costs in the latest auction, representing 38% to 40% of PJM’s $16.4 billion in total capacity costs based on Bowring analysis.[2]
The supply side is also tight. Introl described a 6.6 GW PJM capacity shortfall tied to the 2027 data-center power crisis.[3] American Action Forum reported that PJM capacity auction prices were up 833% since 2024.[4] Those numbers do not translate cleanly into a CPM surcharge. They do establish that the upstream constraint is real enough to affect the economics of new compute capacity.

The delay layer matters as much as the price layer. Data Center Knowledge reported 4-to-7-year queue backlogs for new data-center connections and transformer lead times above 160 weeks, up from 50 weeks in 2021.[5] If a platform, cloud provider, or colocation operator cannot bring capacity online when planned, the cost problem is not limited to higher power bills. Scarcity changes who gets compute, where workloads run, and what premium gets paid for capacity that is already energized.
The causal chain, with the weak links labeled
There is no public study that measures the whole path from a PJM auction clearing price to one advertiser’s CPM inside Meta or Google. So the useful way to read this is link by link, separating what is directly evidenced from what is inferred.
| Link in the chain | Status | What the evidence supports |
|---|---|---|
| PJM capacity pressure | Directly evidenced | PJM auction costs, data-center share of capacity costs, and reported shortfall show material regional grid strain. |
| Data-center build and connection delays | Directly evidenced | Interconnection queues and transformer lead times delay new capacity, especially for power-intensive AI infrastructure. |
| Inference compute scarcity | Inferred from infrastructure constraint | If AI-serving capacity cannot expand on schedule, available inference capacity becomes more expensive or must be allocated more selectively. |
| Ad-platform cost pass-through | Inferred, with account-level symptoms | Platforms do not disclose a PJM surcharge, but rising AI delivery costs can be passed through via auction pricing, optimization thresholds, or bidding behavior. |
| Advertiser CPM, CPA, and ACOS deterioration | Observable inside accounts | Buyers can verify whether platform metrics diverge from blended CAC, ACOS, contribution margin, and regional performance. |
That third link is where the argument can get sloppy if it turns into macro theater. A regional power constraint does not mean every AI model call suddenly costs more everywhere. Meta and Google operate globally. Their data-center footprints, cloud contracts, workload routing, and ad auctions are not confined to PJM. But if a meaningful share of incremental AI-serving capacity is harder or more expensive to build in a key region, it is reasonable to treat that as one input into platform cost pressure.
The commercial projection lines up directionally, though it should not be treated as a neutral forecast. aimagicx projected a 15% to 40% increase in inference compute costs by the end of 2027 due to infrastructure constraints.[6] Because aimagicx sells AI software, the exact range deserves caution. The more defensible takeaway is narrower: credible market participants expect infrastructure constraints to raise inference costs, and PJM is one of the concrete places where those constraints are visible.
Why AI ad products are exposed
This would matter less if AI were a sidecar inside paid media. It is not. Pixis reported that Performance Max now drives 45% of Google Ads conversions and that 78% of Google Ads spend runs through Smart Bidding or PMax.[7] The exact economics of Google’s inference stack are not public, but the dependency is obvious enough: automated bidding, creative assembly, audience expansion, conversion prediction, and placement selection all require ongoing model execution.
The same logic applies to Meta Advantage+ and other AI-heavy buying systems. The more the platform makes decisions at impression time, the more ad delivery depends on compute that has to be powered, cooled, networked, and located somewhere. A marginal increase in inference cost does not need to appear as a separate line item. It can show up as higher reserve prices, less efficient exploration, narrower delivery, more expensive conversion prediction, or a bidding system that needs more spend to produce the same reported outcome.
Reported Meta CPM increases in 2026 add context, not proof. Threadpoint described Meta CPMs rising 13% to 20% across portfolios in 2026.[8] That increase can include ordinary auction competition, creative fatigue, privacy-related signal loss, product changes, and seasonal pressure. The question for a buyer is not whether the whole increase is PJM-driven. It is whether the account shows the specific divergence pattern consistent with hidden compute-cost pass-through.
Meta’s data-center lobbying is a signal, not a receipt
Meta’s own behavior makes the infrastructure issue harder to dismiss. The New York Times reported in January 2026 that Meta spent more than $6 million on TV ads in state capitals and Washington, D.C., to defend data-center construction.[9] That does not tell us how much of an advertiser’s CPM increase came from power constraints. It does suggest Meta views public resistance, permitting, and infrastructure friction around data centers as material enough to fight in the open.
For an operator, that is proxy evidence. Useful, but not sufficient. A lobbying campaign can confirm that infrastructure access matters to the business model. It cannot validate a platform dashboard, explain a bad CAC month, or allocate blame between compute cost, auction density, creative quality, and measurement changes.
What to check inside the account this month
The practical test is divergence. If infrastructure-driven pass-through is hitting the account, it should leave fingerprints in metrics the platform does not fully control. The point is not to wait for Meta or Google to publish a compute-cost note. The point is to reconcile platform-reported performance against the business numbers that decide whether the spend worked.
- PMax ACOS rising while reported ROAS stays flat: treat this as a priority signal, especially when spend is stable or increasing and product mix has not shifted enough to explain the change.
- Platform CPA separating from blended CAC: compare the ad-platform CPA against Shopify, CRM, subscription, or finance-defined CAC on the same time window.
- New-customer CAC worsening faster than all-customer ROAS: the OVRDRV/Haus pattern matters because retention, remarketing, and attribution can defend ROAS while acquisition quality deteriorates.
- CPM increases outpacing normal seasonal pressure: do not call every Q4-style auction move infrastructure pass-through, but flag increases that persist outside expected retail, political, or promotional cycles.
- East Coast geographic drift: segment PJM-served markets against other regions where your business has comparable conversion history, shipping economics, and customer mix.
The geographic check is easy to overstate. PJM serves 13 states and about 67 million people, but ad-platform compute is not necessarily served from the same region as the user seeing the ad. A worse CPA in a PJM-served market does not prove the compute ran there. What it can do is identify whether user-side auction costs, delivery patterns, or regional conversion economics are deteriorating in the same markets where infrastructure pressure is most visible.
A clean diagnostic view should line up four exports: platform performance, actual order or lead data, customer status, and geography. The minimum useful cut is weekly. Daily data is usually too noisy unless spend is large, and monthly data is too slow when CAC deterioration is being hidden by reported ROAS. If the platform says efficiency is stable while finance sees CAC moving, the platform does not get the final vote.
A simple monitoring table
| Signal | What to compare | Why it matters |
|---|---|---|
| Reported ROAS vs. blended CAC | Platform revenue attribution against finance-defined acquisition cost | Shows whether reported efficiency is masking real customer economics. |
| PMax ACOS vs. product margin | Campaign ACOS against contribution margin by product group | Shows whether automation is holding revenue while degrading profitability. |
| Platform CPA vs. CRM-qualified CAC | Ad-platform conversion cost against qualified lead or first-purchase cost | Catches attribution or lead-quality drift. |
| PJM-region performance vs. other regions | Comparable markets by week, excluding obvious promo or shipping distortions | Tests whether geography is part of the deterioration pattern. |
| CPM trend vs. seasonal baseline | Current CPM against the same seasonal period and recent non-promo weeks | Separates normal auction inflation from unusual sustained pressure. |
This is also where campaign structure matters. If every product, audience, and region is collapsed into one automated campaign, the account may still spend efficiently according to the platform while giving the buyer very little evidence about where the economics changed. That does not mean abandoning AI campaigns. It means preserving enough segmentation, naming discipline, and offline reconciliation to detect when automation is buying reported revenue at a worse true cost.
What not to claim from the data
The wrong conclusion is “PJM caused your bad month.” The evidence is not that precise. PJM-region constraints are one input in a global ad-platform cost structure. Meta and Google do not disclose an advertiser-level inference-cost pass-through. CPMs can rise because of competition, creative decay, privacy changes, budget concentration, product launches, political demand, or a measurement update that changes what the platform optimizes toward.
The defensible conclusion is sharper and more useful: PJM-linked infrastructure pressure is now a credible material input into AI ad economics. It sits upstream of the automated systems that increasingly decide impressions, bids, placements, and creative combinations. Because the pass-through can be hidden by stable platform-reported ROAS, buyers should monitor divergence signals instead of treating reported ROAS as the account’s source of truth.
As a baseline for the rest of 2026, this is the entry to update as PJM auction results, interconnection delays, platform CPM reports, and ROAS/CAC divergence studies move. The useful question is not whether infrastructure has become the only explanation for higher AI ad costs. It is whether the account shows the kind of metric split that lets a cost increase hide in plain sight.
References
- Navigating Meta's Rising Costs and Lower Efficiency — OVRDRV.
- Data centers drove $6.3B in PJM capacity auction costs — Utility Dive, July 2026.
- PJM Grid 6GW Shortfall: 2027 Data Center Power Crisis — Introl.
- Emergency Energy Auction to Prevent Data Center-driven Rate Increases — American Action Forum, January 2026.
- Why AI Data Center Projects Face Years of Delays After Approval — Data Center Knowledge.
- The Hidden Cost of AI: Why Data Center Backlash Could Raise Your AI Bills in 2026 — aimagicx.
- Advantage+ vs. Performance Max Head-to-Head (2026) — Pixis.
- Why Are My Meta CPMs So High in 2026? — Threadpoint.
- Meta Campaigns to Change Opinions on Data Centers — The New York Times, January 2026.
Built on this evidence
No Bidding tactic or Creative record currently cites this case file. Compare it against other results in Benchmarks.
Related benchmark reading
Report a corroborating or contradicting result
Seeing something different in your own account? Feed the data-integrity loop instead of leaving an open comment.