
How AI Capex Drives Digital Ad Spend — and What You Can Verify
A quarterly scorecard that tracks the $57B in AI-powered ad spend against $660–690B in hyperscaler AI capex, flagging which platform AI claims are independently confirmed and which remain vendor-stated. Includes a filterable reference table for media buyers to verify claims before trusting them.
- Platform
- Google Ads
- Change category
- bidding
- Change type
- opt-in feature
For Q3 2026, the cleanest read on AI capex’s impact on digital ad spend starts with two numbers that should not be blended into one story. US AI-powered ad spend is projected at $57 billion for 2026, up 63% year over year and equal to 12% of the total US ad market, with a 29% CAGR forecast through 2030; that is a forecast, not a year-end actual.[1][2] Behind the platforms collecting much of that spend, hyperscaler AI capex is estimated at $660 billion to $690 billion in 2026, with some projections putting 2027 spending above $1 trillion.[3][4] That does not prove advertisers are getting incremental sales from AI campaigns. It does explain why every platform AI performance claim needs a provenance label before it goes into a budget deck.

The useful split is not “AI works” versus “AI is hype.” Inside ad accounts, the more practical split is: which number is audited, which number is platform-reported, which number is a forecast, and which number comes from a single-vendor dataset that may be directionally useful but cannot carry the whole media plan.
| Platform / area | Claim | Number / timing | Source | Verification status | Caveat | What a buyer can do with it |
|---|---|---|---|---|---|---|
| US market | AI-powered ad spend is growing quickly | $57B projected for 2026; 63% YoY; 12% of total US ad market; 29% CAGR forecast through 2030 | Madison and Wall via Business Insider; eMarketer [1][2] | Forecast / industry projection | Not a confirmed full-year actual; 2026 totals will not be known until after the year closes. | Use for market sizing and board-level context, not as proof that a specific AI campaign is incremental. |
| Hyperscalers | AI infrastructure spending is accelerating | $660B–$690B estimated hyperscaler AI capex in 2026; projected to top $1T in 2027 | Futurum Group; CNBC [3][4] | Forecast / analyst and market estimate | Capex pressure helps explain why platforms need strong AI narratives; it does not measure advertiser ROI. | Use as context when evaluating why platforms are pushing automation defaults and publishing AI performance claims. |
| Meta | Ad revenue grew strongly in Q1 2026 | 33% ad revenue growth in Q1 2026 | Audited earnings as summarized in Digital Applied’s 2026 budget readout [5] | Confirmed platform financial | Confirms Meta’s ad business growth, not the incrementality or profitability of any advertiser’s Advantage+ campaign. | Safe to cite as platform growth; not safe to cite as advertiser ROI. |
| Meta Advantage+ | Advantage+ produced strong ROAS | $4.52 ROAS | Vendor-stated Meta figure, labeled in Digital Applied’s methodology [5] | Vendor-stated | Platform ROAS depends on attribution, conversion source, account setup, and what would have happened without the campaign. | Use as a place to look in your own accounts; require holdout or advertiser-owned incrementality before reallocating budget. |
| Meta GEM | GEM ranking system is more efficient | “4x more efficient” | Meta engineering claim, labeled via Digital Applied [5] | Vendor-stated technical claim | A ranking-system efficiency claim is not the same as lower CPA, higher margin, or incremental revenue for an advertiser. | Treat as product-direction evidence; do not translate directly into a performance forecast. |
| Meta AI creative tools | Advertiser usage expanded | 8M advertisers using AI creative tools, doubled from 4M in Q4 2024 | Meta-reported actual, via Digital Applied [5] | Platform-reported adoption | Adoption shows usage, not effectiveness. It does not say whether those advertisers improved cash conversion. | Use to understand workflow momentum and client expectations; do not cite as performance proof. |
| Meta EU fees | EU location-based fees announced | 2%–5% fees beginning July 1, 2026 | eMarketer, cited in the supplied source set [2] | Confirmed announcement | Fee existence is confirmed; advertiser-level dollar exposure depends on spend mix and geography. | Use in budget pacing, market-level forecasting, and client billing discussions. |
| Meta Andromeda | Retrieval system changes expanded Meta’s ad ranking stack | Product change reported in 2026 coverage | Search Engine Land coverage cited in Digital Applied [5] | Independently reported product change | Product architecture coverage confirms direction of automation, not lift. | Use to explain why account behavior may change; verify effect in your own campaigns. |
| Meta Manus workflow | Ads Manager workflow automation went live | Live February 17, 2026 | MediaPost coverage cited in Digital Applied [5] | Independently reported product change | Workflow availability is not a performance benchmark. | Use for ops planning, naming conventions, approvals, and permissions. |
| Google Search | Search ad revenue grew in Q1 2026 | 19% Search ad growth in Q1 2026 | Alphabet earnings as summarized in Digital Applied’s 2026 budget readout [5] | Confirmed platform financial | Confirms Search revenue growth; it does not isolate the contribution of AI or prove advertiser incrementality. | Safe to cite as platform growth; pair with account-level tests before changing budget rules. |
| Google Network | Google Network revenue declined | -4% in Q1 2026 | Alphabet earnings as summarized in Digital Applied’s 2026 budget readout [5] | Confirmed platform financial | Confirms revenue movement in one segment, not campaign-level efficiency. | Use when explaining channel mix pressure; do not overread it as a buyer-level performance result. |
| Google Performance Max | Performance Max has become a large share of Google Ads spend | 35% of total Google Ads spend | Ryze AI dataset [6] | Single-vendor dataset | Useful directional benchmark, but not an industry-wide audit. Account mix may differ sharply. | Compare against your own Google Ads allocation; investigate if your account is being pushed above comfort levels. |
| Google Performance Max | Performance Max CPCs run higher than comparable Search-only campaigns | 22% higher average CPCs than equivalent Search-only campaigns | Ryze AI analysis of 10,000+ accounts [6] | Single-vendor dataset | May reflect campaign mix, vertical competition, query coverage, and automation choices; not proof that PMax causes higher CPCs in every account. | Use as a watchlist metric: check CPC, marginal CPA, and incremental revenue before scaling. |
| Google Smart Bidding | Smart Bidding is widely adopted | 78% of Search campaigns | Ryze AI industry data [6] | Industry data / adoption signal | Adoption is not effectiveness. Broad use can also make the auction more algorithmically crowded. | Use to benchmark automation exposure; do not assume the median account is winning from it. |
| Google AI Overviews | AI Overviews reduced organic click supply | 15%–20% reduction | Ryze AI analysis [6] | Single-vendor dataset | This is a click-supply pressure signal, not a confirmed causal estimate across all advertisers. | Watch paid search demand, impression share, brand/nonbrand mix, and blended search profitability. |
| Google Smart Bidding | LTV-oriented bidding increased upfront CPCs | 15%–25% upfront CPC inflation | Ryze AI analysis [6] | Single-vendor dataset | May be true for accounts using LTV-oriented strategies in competitive auctions; not a universal Google Ads rule. | Check whether higher CPCs are matched by later-value realization, not just modeled value. |
| Competitive CPCs | AI-startup funding intensified vertical auction pressure | $67B in AI-startup venture funding in 2025; legal CPCs +34%, B2B software +31%, insurance +28% | Ryze AI industry benchmarks [6] | Single-vendor dataset | Vertical benchmarks are useful pressure signals, but they do not replace your own auction insights and margin math. | Use in forecasts and client expectation-setting; validate against account-level CPC and close-rate changes. |
| Investor pressure | AI capex pressure is visible in cash-flow scrutiny | Meta free cash flow fell from $26B in Q1 2025 to $1.2B in Q1 2026 despite 33% ad revenue growth | Reuters [7] | Reported financial context | This is platform-level finance context, not an advertiser performance measure. | Use to understand why favorable AI payoff stories matter; keep it out of campaign ROI claims. |
The labels matter more than the adjectives
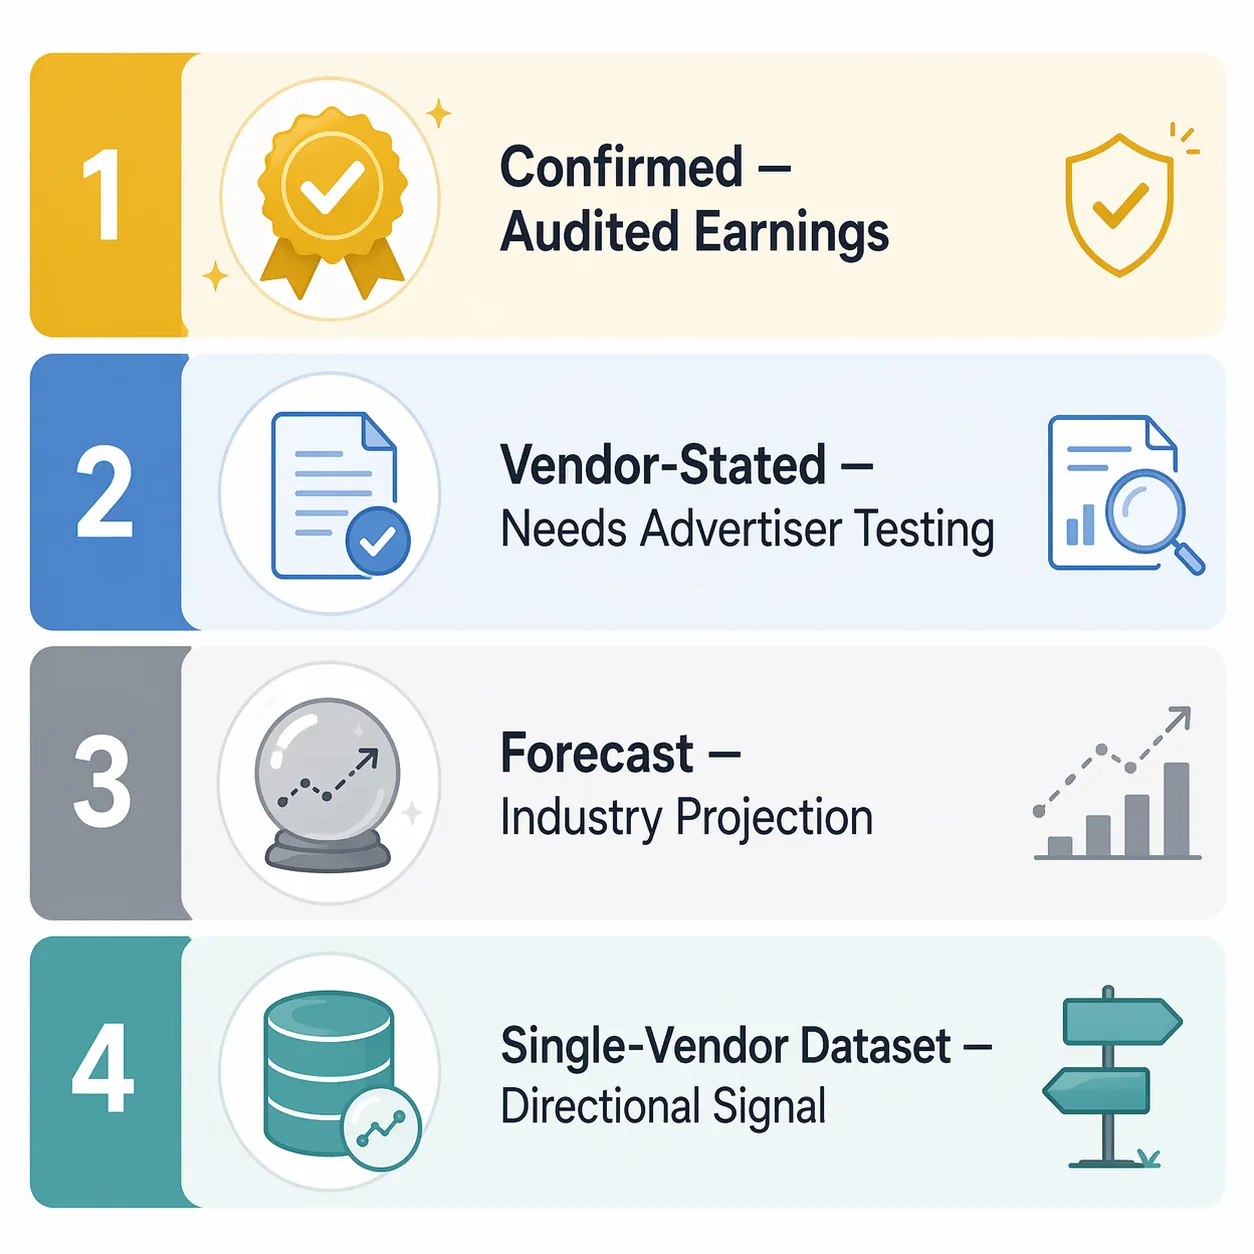
A confirmed platform financial is sturdy in a way a product claim is not. If Meta reports 33% ad revenue growth or Google reports 19% Search ad growth, those are platform business facts that have gone through a higher standard than an engineering blog or product webinar.[5] They are still not advertiser ROI facts. Revenue growth can come from more advertisers, higher prices, more impressions, mix shift, better products, or some combination that is not visible from the outside.
A vendor-stated performance claim can be useful, but it belongs in the “where to look” column. Meta’s $4.52 Advantage+ ROAS figure is not meaningless; it tells buyers that Meta wants Advantage+ evaluated as a serious performance surface.[5] It does not tell a specific advertiser whether the campaign created revenue that would not have arrived through brand demand, retargeting overlap, email, organic search, retail availability, or another paid channel.
A forecast should be handled as planning context. The $57 billion AI-powered ad spend number is helpful because it shows that AI buying, targeting, creative, and measurement products are becoming normal parts of media budgets.[1][2] It should not be used to argue that the average AI-powered campaign is profitable. It measures projected spend flowing through systems, not verified incremental profit coming out of them.
A single-vendor dataset sits somewhere in the middle. Ryze AI’s Google Ads benchmarks are worth watching because they come from a large operational dataset of more than 10,000 accounts, but they are still one vendor’s view into a slice of the market.[6] That makes them good for pressure checks — “are CPCs rising in this vertical?” or “is PMax taking more budget than it used to?” — and weaker for absolute claims about what will happen in a different account.
Meta: strong audited growth, weaker proof of advertiser incrementality
Meta has the most mixed scorecard because its 2026 story includes almost every claim type at once: audited revenue growth, platform ROAS, engineering efficiency, advertiser adoption, fee changes, and workflow automation. Collapsing those into one “Meta AI is working” sentence is how a media plan gets oversold.
The 33% Q1 2026 ad revenue growth number is the safest Meta figure to cite because it is a platform financial result.[5] It says Meta’s advertising business expanded sharply. It does not say whether an Advantage+ Shopping campaign produced incremental customers for a DTC account, whether a lead-gen account improved qualified pipeline, or whether a retailer’s modeled ROAS survived after store returns and promo costs were accounted for.
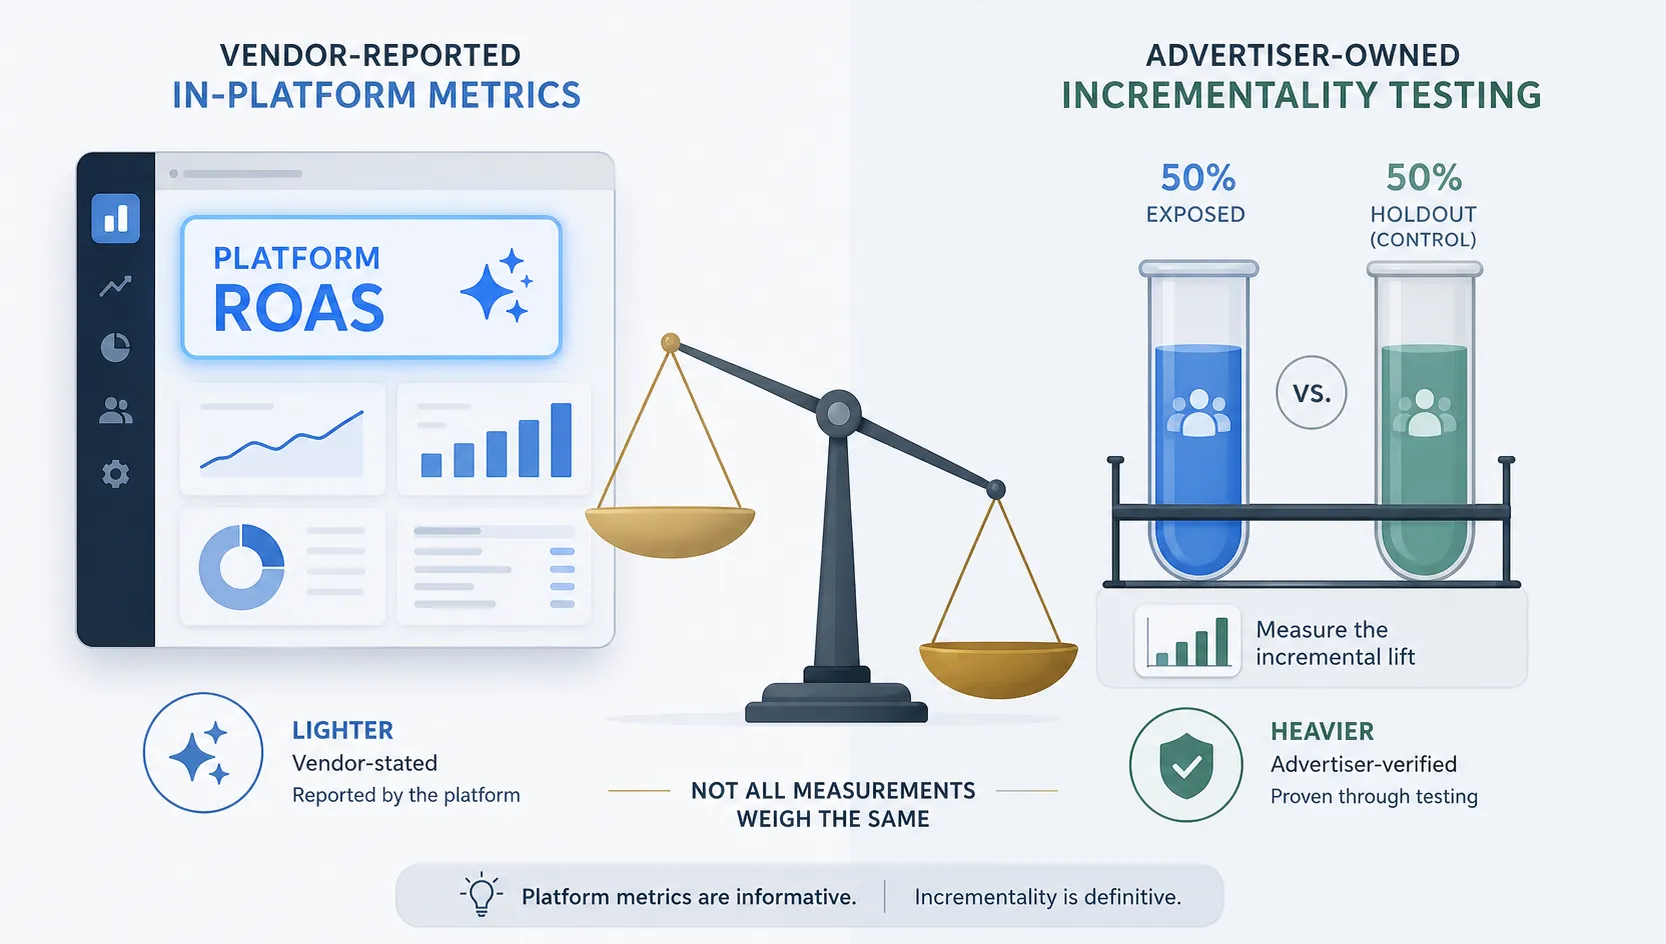
The $4.52 Advantage+ ROAS claim sits in a different bucket. Platform ROAS can be a useful operating metric when the account is clean, the pixel is stable, conversion values are not inflated, and the buyer knows what is inside the attribution window. It is still a platform-reported outcome. Without a holdout, it cannot separate new demand from harvested demand. That distinction matters most when the number has already made its way into a forwarded email with a note like, “Should we move more budget here?”
The GEM “4x more efficient” claim needs an even tighter label.[5] A ranking system becoming more efficient may be excellent engineering. It may help Meta consider more candidate ads, improve retrieval, lower serving costs, or make the auction respond faster. None of those possibilities automatically equals a lower business CPA. A buyer can treat the claim as evidence that Meta is investing in the machinery behind automated delivery, not as a reason to relax incrementality standards.
The 8 million advertisers using Meta AI creative tools, doubled from 4 million in Q4 2024, is also an adoption fact rather than an effectiveness fact.[5] Adoption can rise because a tool is good, because it is defaulted into workflows, because teams are understaffed, because clients want more creative variations, or because the platform makes the old workflow feel slower. For account operators, the number is still useful: it tells you that creative automation is no longer a fringe behavior and that approval processes, naming conventions, and asset QA need to catch up.
Meta’s EU location fees are easier to place. The announced 2% to 5% fees beginning July 1, 2026 are budget inputs, not performance claims.[2] They belong in forecast sheets, margin checks, and regional pacing discussions. The mistake would be mixing a confirmed fee with an unconfirmed performance offset — for example, assuming automation lift will cover the fee before the account has proved it.
Andromeda and Manus are better read as operating signals. Andromeda coverage points to continued changes in Meta’s retrieval and ranking layer, while the Manus workflow going live on February 17, 2026 points to more automation inside Ads Manager workflows.[5] Those changes can affect how campaigns behave and how teams work. They do not settle the budget question by themselves.
Google: confirmed Search growth, directional auction-pressure data
Google’s scorecard is a little cleaner because the confirmed financials and the operational benchmarks fall into separate piles. The 19% Search ad growth in Q1 2026 and the 4% Google Network decline are platform financial facts.[5] They show where revenue is moving. They do not isolate AI’s contribution, and they do not prove that a buyer’s Performance Max or Smart Bidding setup is producing incremental sales.
The Ryze AI figures are useful because they sound like what buyers are seeing in accounts: Performance Max taking more share, Smart Bidding becoming table stakes, and CPCs feeling heavier in competitive verticals. But each figure needs the single-vendor dataset caveat kept attached. Performance Max at 35% of total Google Ads spend is a meaningful benchmark if your account is drifting toward that mix without a deliberate decision.[6] It is not a universal recommendation to run 35% of spend through PMax.
The 22% higher CPC figure for Performance Max versus equivalent Search-only campaigns should be used as a diagnostic prompt, not as a verdict.[6] PMax can enter different auctions, use different inventory, respond to different asset quality, and chase different modeled outcomes. A higher CPC may be a problem if marginal conversion value is not improving. It may be acceptable if the campaign is finding customers that Search-only coverage missed. The platform report will not answer that on its own.
Smart Bidding being used on 78% of Search campaigns is mostly an adoption signal.[6] In practical terms, it means a buyer opting into automated bidding is not gaining novelty; they are entering the current auction baseline. The performance question moves from “Should we use automation?” to “What objective, value signal, exclusions, budget constraints, and test design keep automation from optimizing toward a clean-looking report and a weaker cash result?”
AI Overviews and CPC inflation are where the paid and organic sides start to collide. Ryze AI’s analysis says AI Overviews reduced organic click supply by 15% to 20%, while LTV-oriented Smart Bidding inflated upfront CPCs by 15% to 25%.[6] If both pressures show up in an account, the buyer may see paid search absorbing more demand at a higher entry price. That is a plausible operating concern, but it is still not a platform-independent causal estimate across every advertiser.
The vertical CPC benchmarks deserve the same treatment. Ryze AI links $67 billion in AI-startup venture funding in 2025 with auction pressure in legal, B2B software, and insurance, where CPCs rose 34%, 31%, and 28%, respectively.[6] For a media buyer, that is enough to revisit forecasts and explain why old CPC assumptions may be stale. It is not enough to tell a CFO that the next dollar in Smart Bidding will clear the company’s margin target.
The capex backdrop explains the incentive, not the campaign result
The $660 billion to $690 billion AI capex backdrop matters because advertising is one of the clearest places where the major platforms can point to revenue attached to AI infrastructure.[3] When capex is that large, favorable AI performance narratives are not just product marketing; they are part of the broader payoff story investors are watching.
That pressure is visible in how sharply investors scrutinize cash flow. Reuters reported that Meta’s free cash flow fell from $26 billion in Q1 2025 to $1.2 billion in Q1 2026 despite 33% ad revenue growth.[7] A buyer does not need to turn that into a conspiracy theory. It is enough to understand the incentive structure: the platforms have every reason to show that AI infrastructure is translating into better ad products, higher revenue, and more automated spend.
The mistake is treating platform-level need as advertiser-level evidence. Google and Meta can both grow ad revenue while some advertisers improve, some overpay, some shift spend from one campaign type to another, and some lose visibility into what actually caused the sale. Audited growth and advertiser incrementality live in different tabs.
Transparency is valued until performance looks cheaper
Madison and Wall’s observation about buyer behavior is uncomfortable because it matches how many accounts are actually managed: advertisers say they value transparency, but there is “little evidence they are not willing to trade transparency and control for price and performance.”[1] That trade is not automatically irrational. If a platform black box keeps hitting a real margin target, many teams will accept less control.
The problem starts when the price-and-performance side of that trade is measured only by the same platform asking for more control. If Advantage+ or Performance Max reduces grunt work, finds demand a manual structure missed, and survives incrementality testing, it deserves budget. If it only improves in-platform ROAS while blended revenue, qualified pipeline, or contribution margin fails to move, the automation did not earn the same conclusion.
The missing benchmark: independent advertiser-reported AI ad ROI
Within the materials reviewed for this Q3 2026 scorecard, no independent advertiser-reported AI ad ROI benchmark was found that would allow a clean comparison against Meta’s Advantage+ ROAS, Meta’s GEM efficiency claim, Google’s Performance Max benchmarks, or Google Smart Bidding pressure signals. That gap is the practical center of the issue. The market has forecasts, platform earnings, vendor claims, and operational datasets. It does not have a neutral, broadly applicable number that tells a buyer, “AI automation added this much incremental profit across advertisers like you.”
So the verification job moves back into the account, the CRM, the order system, the finance model, and the awkward meeting where someone has to explain why a platform-recommended setting made the dashboard look better but did not improve cash conversion.
What platform metrics can and cannot answer
| Metric type | What it can answer | What it cannot answer |
|---|---|---|
| Platform ROAS | How the platform attributes conversion value to campaigns under its rules. | Whether those conversions were incremental to the business. |
| In-platform lift or optimization claim | Whether the platform observed better modeled performance under its experiment or reporting setup. | Whether the result holds under advertiser-owned revenue, margin, or customer-quality definitions. |
| Auction-efficiency claim | Whether a model, ranking system, or bidding process became more efficient inside the platform. | Whether the advertiser paid less for incremental profit. |
| Adoption metric | How many advertisers or campaigns are using a tool. | Whether the tool improved performance. |
| Audited platform revenue | Whether the platform’s ad business grew or declined. | Whether a buyer should increase spend in a specific automated campaign type. |
| Advertiser-owned incrementality read | Whether exposed markets, audiences, or cells produced more business outcome than a comparable withheld group. | Whether the platform’s internal model is technically better. |
This is why a platform ROAS screenshot should not be asked to do the job of a holdout. Platform ROAS is an attribution view. A holdout is a counterfactual attempt. One allocates credit; the other asks what changed because the media ran. They can both be useful, but they are not substitutes.
A buyer-side verification workflow that fits real accounts
The test does not have to become an academic project, but it does need to be owned by the advertiser rather than entirely by the platform. The goal is to decide whether an AI-driven change deserves budget, not whether the platform can produce a nicer-looking optimization chart.
- Define the budget decision before the test. Examples: move budget from standard Shopping to Performance Max, expand Advantage+ into broader prospecting, accept a higher CPC under LTV bidding, or allow AI creative variants into production.
- Choose the business outcome that will survive outside the ad platform. For ecommerce, that may be net revenue, contribution margin, first-order profit, or new-customer revenue. For lead generation, it may be qualified opportunities, closed-won revenue, or lead quality after sales review.
- Create a holdout or comparison structure before the automated change goes live. That may be a geographic holdout, audience exclusion, staggered rollout, matched-market setup, or another structure the business can actually maintain.
- Lock the messy operational details: campaign names, budget labels, conversion actions, promo periods, feed changes, creative launch dates, landing page changes, and sales constraints. Most bad tests fail in the handoff between media ops and reporting.
- Read incremental business outcome against incremental spend. Do not stop at the campaign ROAS column if the finance team cares about margin, payback, or qualified pipeline.
- Decide in advance what result changes the budget. If the test only produces a better platform metric and no business movement, keep the claim directional.
The most important part is not the statistical vocabulary; it is protecting the comparison. If the holdout market gets a different promo, the CRM field breaks, the feed changes halfway through, or the sales team stops following up at the same rate, the test becomes another argument instead of a decision tool.
For smaller accounts, a perfect holdout may be unrealistic. That does not make platform claims automatically true. It means the buyer should lower the confidence label: use staggered launches, compare matched regions where possible, watch blended business metrics, and avoid treating one good platform-reported period as proof of durable incrementality.
How to use the scorecard in budget conversations
When a CFO, founder, or client forwards a platform claim, the response does not need to be defensive. It needs to be labeled. A clean answer might be: “Meta’s ad revenue growth is confirmed. The Advantage+ ROAS figure is vendor-stated. We can compare it against our own holdout before moving budget.” That is much stronger than arguing about whether the platform is good or bad.
The same works for Google. “Search revenue growth is confirmed. The PMax and CPC figures are from a single-vendor dataset, so we should use them as pressure signals. In our account, the decision should come from marginal CPA, qualified revenue, and incrementality.” That keeps the conversation anchored in what each number can actually carry.
The operating rule for Q3 2026 is disciplined but not anti-automation: audited platform financials can confirm platform growth; vendor claims can suggest where to look; single-vendor datasets can flag directional pressure; forecasts can frame market movement. Advertiser-owned incrementality tests are still required before treating AI ad performance claims as budget-changing truth.
References
- AI-powered ads are driving US ad growth, Madison and Wall says — Business Insider, 2026.
- AI-powered ad spend will hit $57 billion in 2026 as brands go all in — eMarketer.
- AI Capex 2026: The $690B Infrastructure Sprint — Futurum Group.
- AI boom: Big Tech capital expenditures now seen topping $1 trillion in 2027 — CNBC, April 30, 2026.
- Meta Overtakes Google Ad Revenue 2026 Budget Readout — Digital Applied.
- Google Ads CPC Trends 2026: What Is Changing — Ryze AI.
- Investors punish Big Tech AI spending that delivers slower growth — Reuters, January 29, 2026.
Primary source: https://www.businessinsider.com/ai-powered-ads-driving-us-ad-growth-2026