
What a Friday Pizza Promo Really Costs in Paid Ads
The benchmark file for Friday pizza promos: what real accounts actually spend on paid social and search ($40 test budgets, ~$4.84 CPM, $0.90–$1.30 CPC) versus platform- and vendor-reported ROAS that spans 2.1x–21.4x, with provenance and dates on every claim. Use it to set defensible spend expectations and judge which vendor numbers would survive scrutiny in your own account.
- Platform
- Meta Ads0 Google Ads
- Campaign type
- Search0 Advantage+
- Spend range
- $0 total; $20/day; $150–$200/week
- Timeframe
- 0 days; within a month
- ROAS
- 0x–21.4x
- Verdict
- mixed result
- Industry vertical
- Pizza restaurant
- Last reviewed
- 0-08-01
The numbers to put in the Friday plan
For a Friday pizza promo in paid ads, the defensible plan starts with two small-account anchors: an agency-reported $40 Facebook promo at $4.84 CPM for a Cincinnati pizza joint, and an operator-reported Google Ads account for Soda Creek Pizza that moved from about $1.30 CPC to about $0.90 CPC after tracking and scheduling changes. The ROAS material in the same category is much wider: a Meta claim for Domino’s Pizza Spain at 2.1x higher ROAS, a WeatherAds/Papa Johns UK case at 9.49 ROAS, and Chowly-reported restaurant Google Ads ROI from 7.76x to 21.4x.[1][2][3][4][5]
Those numbers do not belong in the same line of a proposal without provenance. The first two are named-account operating records, useful as cost anchors. The later ROAS and ROI figures are platform or vendor claims, useful mainly because buyers will see them in decks and need to know how much weight to give them.
| Account or claim | Channel and budget | Metric that mattered | Provenance and date treatment | How to use it |
|---|---|---|---|---|
| Cincinnati pizza joint via Robben Media | Facebook promo; $40 total spend at $5/day over 8 days | 8,259 reached; $4.84 CPM; $0.0048 per person reached; 266 post clicks; sales tripled versus the prior-year week; roughly $15,000 profit | Agency case study; page last reviewed Aug. 1, 2026 where page dating is incomplete [1] | Cheap-reach anchor for a local social test; not proof that $40 creates $15,000 profit in another account |
| Soda Creek Pizza, Steamboat Springs, Colorado | Google Ads; started at $20/day; later $150–$200/week | About $1.30 CPC and 4%+ CTR, then after conversion tracking, variable bidding, and business-hours scheduling: roughly 9% CTR, about $0.90 CPC, position 1.3, and sales up about 30% within a month | Operator report via PMQ; page last reviewed Aug. 1, 2026 where page dating is incomplete [2] | Search-intent anchor for small pizza accounts; strongest when tied to tracked orders and actual open hours |
| Domino’s Pizza Spain | Meta Advantage+ sales/app campaign claim; spend not supplied in the available repost | 2.1x higher ROAS | Platform claim from Meta, available here through Topkee repost because the Meta page sits behind a login wall; last reviewed Aug. 1, 2026 [3] | Automation proof point only; do not treat as a local-store Friday forecast |
| Papa Johns UK via WeatherAds | Meta weather-adaptive creative case; spend not supplied | ROAS 9.49; 58% lower cost per order, footnoted by WeatherAds as reported by Meta; weather-triggered creative beat generic creative by 12.5% on cost per sale | Vendor case study; last reviewed Aug. 1, 2026 where page dating is incomplete [4] | Useful creative mechanic; attribution and cost-per-order definitions need account-level verification |
| Chowly restaurant Google Ads material | Restaurant Google Ads guidance; spend not supplied for the range | ROI range of 7.76x–21.4x on restaurant Google Ads accounts | Vendor-reported guidance; last reviewed Aug. 1, 2026 where page dating is incomplete [5] | A vendor range, not a transferable pizza guarantee |
What the $40 Facebook test actually proves
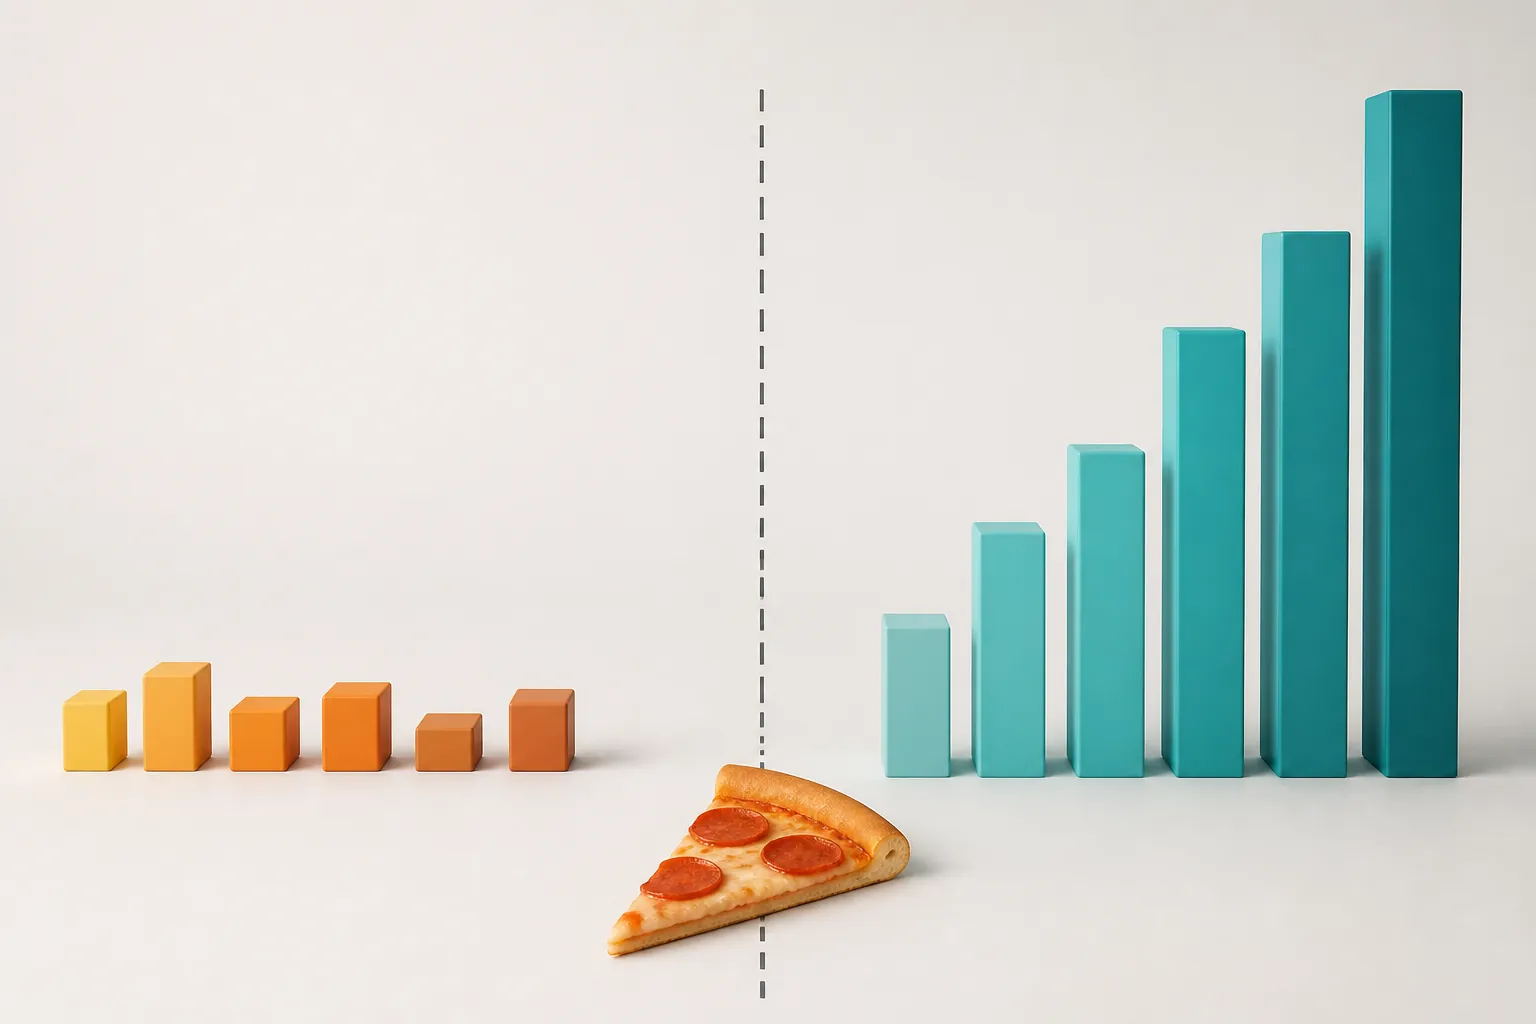
Robben Media’s Cincinnati pizza case is useful because the spend is small enough to audit in your head. The agency says the promotion ran for 8 days at $5/day, reached 8,259 people, produced a $4.84 CPM, cost $0.0048 per person reached, and generated 266 post clicks.[1] For a local account, that is not a brand manifesto. It is a cheap-reach test with a real receipt.
The stronger part of the case is not the click count. It is the comparison to the prior-year week. Robben reports that sales tripled versus that prior-year week and that the promotion produced roughly $15,000 in profit.[1] That is the kind of Monday-morning number an owner understands. It is also the number that needs the most caution: the source is an agency case study, not an independent audit, and the result can include offline ordering, existing customer demand, local attention, franchise or neighborhood familiarity, and repeat behavior that a Facebook dashboard may not separate cleanly.
The creative note matters too. The agency says the creative was rushed from a news photo.[1] That does not make rushed creative a strategy. It does show that a small Friday promo does not always need polished studio assets before it can find local buyers. For a pizza shop, a timely offer with recognizable local context can be a better first test than waiting for a production cycle that costs more than the media.
The right way to carry this case into a plan is narrow: a $40 paid-social test can be enough to check whether the offer, radius, copy, and neighborhood familiarity can generate visible order movement. It does not set a universal profit multiple. If food cost, labor, third-party delivery fees, or discount depth have changed, the ceiling belongs in the margin math before the campaign launches. The same logic shows up in account planning when a buyer has to recalculate CPA tolerance after unit economics move, not after the report looks good; this margin-ceiling frame is the useful comparison.
Soda Creek is the better search-intent anchor
Soda Creek Pizza gives the cleaner search-side operating range. The PMQ report says the account began with Google Ads at $20/day, generating about $1.30 CPC and a CTR above 4%.[2] That is the useful starting point for a shop trying to capture people already searching for pizza, delivery, takeout, or a nearby dinner option.
The account then improved after three practical changes: conversion tracking, variable bidding, and scheduling ads during business hours. PMQ reports that performance moved to roughly 9% CTR, about $0.90 CPC, average position 1.3, and sales up about 30% within a month; later, the account spent $150–$200 per week.[2] The interesting part is not that “Google Ads works for pizza.” It is that the account stopped buying clicks in the abstract and started matching bids to hours, measurement, and demand.
A buyer can turn that into a rough planning calculation without pretending the calculation is a forecast. At $150–$200 per week, the reported CPC range of about $0.90–$1.30 would imply roughly 115 to 222 clicks if the CPC held. That range is only arithmetic from the reported inputs, not an outcome guarantee.[2] The missing number is orders, and orders depend on menu fit, landing page or ordering flow, call handling, delivery radius, and whether the store is actually open and staffed when the click arrives.
Search also creates a different attribution problem from paid social. A branded or near-me query may have happened without the ad. A Friday offer may pull an order forward from Saturday. A hungry existing customer may click because the ad is convenient, not because the ad created the customer. For Google Ads budget decisions, the more useful habit is account-level proof over aggregate headlines; the same standard applies in broader Google Ads budget debates.
The ROAS claims get wide once provenance changes
The platform and vendor claims are still worth keeping in the file because they show what sales decks will sound like. The Domino’s Pizza Spain figure is a Meta claim for Advantage+ sales/app campaigns, available here through Topkee’s repost, reporting 2.1x higher ROAS.[3] The available material does not supply the small-account details a local buyer would need: spend, market conditions, baseline orders, app-order attribution, or store-level margin.
WeatherAds’ Papa Johns UK case is more mechanically interesting. It reports ROAS of 9.49 and a 58% lower cost per order, with the cost-per-order figure footnoted as reported by Meta. It also reports that weather-triggered creative beat generic creative by 12.5% on cost per sale.[4] That gives a usable tactic: weather can change the message and the offer. It does not tell a franchisee what a rainy-Friday budget should be without that franchisee’s own order baseline and attribution rules.
Chowly’s restaurant Google Ads guidance reports ROI from 7.76x to 21.4x on restaurant Google Ads accounts.[5] That may be useful as a vendor-reported range for restaurant search, but it is not a pizza-only distribution, not an independently audited benchmark, and not a promise that a local Friday promo will land inside the range.
Putting 2.1x, 9.49, and 21.4x next to one another is not a lesson that pizza ads have a huge hidden upside. It is a reminder that ROAS changes with attribution windows, app orders, platform credit, existing brand demand, repeat visits, and whether walk-ins or phone orders are counted. The available platform and vendor materials do not provide independent audits of those claims.[3][4][5]
This is where automated campaign reports can become hard to defend. If Advantage+ or Performance Max takes credit for demand that the shop would have captured anyway, the dashboard can look better than the week’s actual economics. The same dispute shows up in broader post-mortems around automated-campaign attribution: the account’s cash result has to survive outside the platform interface.
The measurement frame for a Friday promo
Chowly’s pizza-promotion guidance points to the frame that separates profitable promos from noisy promos: incremental orders above a baseline, profit per order, and repeat rate within 60 days.[6] That is the standard to build before the first impression serves, because once the Friday rush starts, the account will produce more numbers than the operator can reconcile.
| Metric | What it answers | How to read it |
|---|---|---|
| Spend | How much money was actually risked | Separate paid-social test spend from search-intent spend; do not average channels together |
| CPM | Whether local reach was cheap enough to justify the test | Useful for Facebook-style awareness or offer distribution; weak by itself for proving orders |
| CPC | What the account paid for a site visit, menu click, call click, or post click | Compare search CPC against the Soda Creek range only after checking geography and query intent |
| CTR | Whether the message matched the audience or query | A high CTR can still be existing demand clicking a convenient ad |
| Cost per order | How much paid media appears to spend for each tracked order | Only as good as the order tracking, call handling, app attribution, and coupon discipline |
| Incremental weekly orders above prior-year baseline | Whether Friday produced more business than a comparable week | The most useful order metric when seasonality and day-of-week patterns are visible |
| Profit per order | Whether discounting and delivery costs left money after the rush | Use contribution profit, not gross ticket size |
| Repeat rate within 60 days | Whether the promo bought one-off bargain hunters or customers worth seeing again | Read separately for new customers and existing customers when the ordering system allows it |
For a small Friday test, the plan can stay simple. Put the prior-year same-week order count in the sheet before launch. Decide whether the media job is cheap local reach, search-intent capture, or both. Cap the first spend against the two named-account anchors rather than against the highest ROAS claim in the file. Mark orders with a promo code, ordering link, call note, or POS flag if the operation can handle it. Then reconcile platform orders against actual sales, refunds, third-party fees, and walk-ins.
Pacing still matters. A Friday pizza flight that exhausts budget before dinner has solved nothing; a campaign that spends after the kitchen closes is worse. For Q3 and Q4 promo flights, the useful comparison is not a generic restaurant CPM chart, but how the account paces when competition and auction pressure rise. That is why broader promo-flight pacing records are worth checking before a holiday or game-weekend push.
The decision rule is plain: a Friday pizza promo is not validated by dashboard ROAS alone. It is validated when incremental weekly orders beat the prior-year baseline, the added orders carry enough profit per order to pay for the discount and media, and a measurable share of those buyers returns within 60 days.
References
- Facebook Ads Case Study: $15,000 In 8 Days — Robben Media
- 5 Tips for Managing a Google Ads Campaign For Your Pizzeria — PMQ
- Catering Facebook Ads Retargeting Lookalike — Topkee
- Delivering Hot Results: Papa Johns Improve CPA by 58% With Weather-Adaptive Ads on Meta — WeatherAds
- Google Ads for Restaurants: The Complete ROI-Focused Guide — Chowly
- Profitable Pizza Promotions Ranked — Chowly
Built on this evidence
No Bidding tactic or Creative record currently cites this case file. Compare it against other results in Benchmarks.
Related benchmark reading
Report a corroborating or contradicting result
Seeing something different in your own account? Feed the data-integrity loop instead of leaving an open comment.