
What Alphabet's AI Strategy Means for Google Ads Budgets
Alphabet's Q2 2026 kept Search ads growing (+17% to $63.3B), but that's the first step-down in six quarters, the open-web Network shrank, and Google's AI-tool lift claims conflicted across its own channels. The operator's takeaway: base Q3-Q4 Google Ads budget decisions on account-level data and the harder Q3 comp, not aggregate headlines.
- Platform
- Google Ads
- Bid strategy
- AI Max
- Difficulty
- Advanced
- Last reviewed
- 0-07-31
Grounded in benchmark case file: Benchmarks hub (no durable AI Max record yet)
The practical Google Ads implication of Alphabet’s AI business strategy is not “pull money out of Search before AI eats it.” It is also not “raise budgets because Alphabet had a great quarter.” For a Q3–Q4 media plan, Q2 2026 gives enough reassurance to keep Search in the plan, and enough friction to keep every incremental dollar tied to account-level proof.
Alphabet filed Q2 2026 results on July 22, 2026. The ad numbers that belong on the first budget slide are simple: total revenue was $119.8 billion, up 24% year over year; Search & other ads were $63.3 billion, up 17%; YouTube ads were $11.1 billion, up 13%; and Google Network was $7.3 billion, down about 1%, the only declining ad line in the table.[1][2][3]
| Alphabet Q2 2026 line item | Revenue | YoY change | Budget read |
|---|---|---|---|
| Total revenue | $119.8B | +24% | Strong company-level result; not a direct Google Ads account signal. |
| Google Search & other ads | $63.3B | +17% | AI Overviews and AI Mode have not shown up as Search revenue collapse. |
| YouTube ads | $11.1B | +13% | Still growing, but a separate buying surface with different intent and measurement. |
| Google Network | $7.3B | About -1% | The weak ad line; treat open-web exposure more carefully. |

That table answers the panic version of the question first. A year into AI Overviews and AI Mode, Alphabet’s Search ad revenue is still growing at a rate most mature ad businesses would envy. What it does not answer is whether your marginal nonbrand click is cleaner, whether Performance Max is taking credit for demand Search created, or whether a query class that used to convert through a standard text ad is now being resolved inside an AI experience.
Search growth can be strong and still deserve a closer read
The cleanest revenue-side argument against an AI-cannibalization collapse is the Search line itself. Digital Applied’s recomputation from quarterly SEC filings shows Search & other ad growth moving from +10% in Q1 2025 to +12%, +15%, +17%, +19% in Q1 2026, then +17% in Q2 2026. That makes Q2 the first step-down after six quarters in that run, while still marking the 12th straight double-digit quarter.[4]
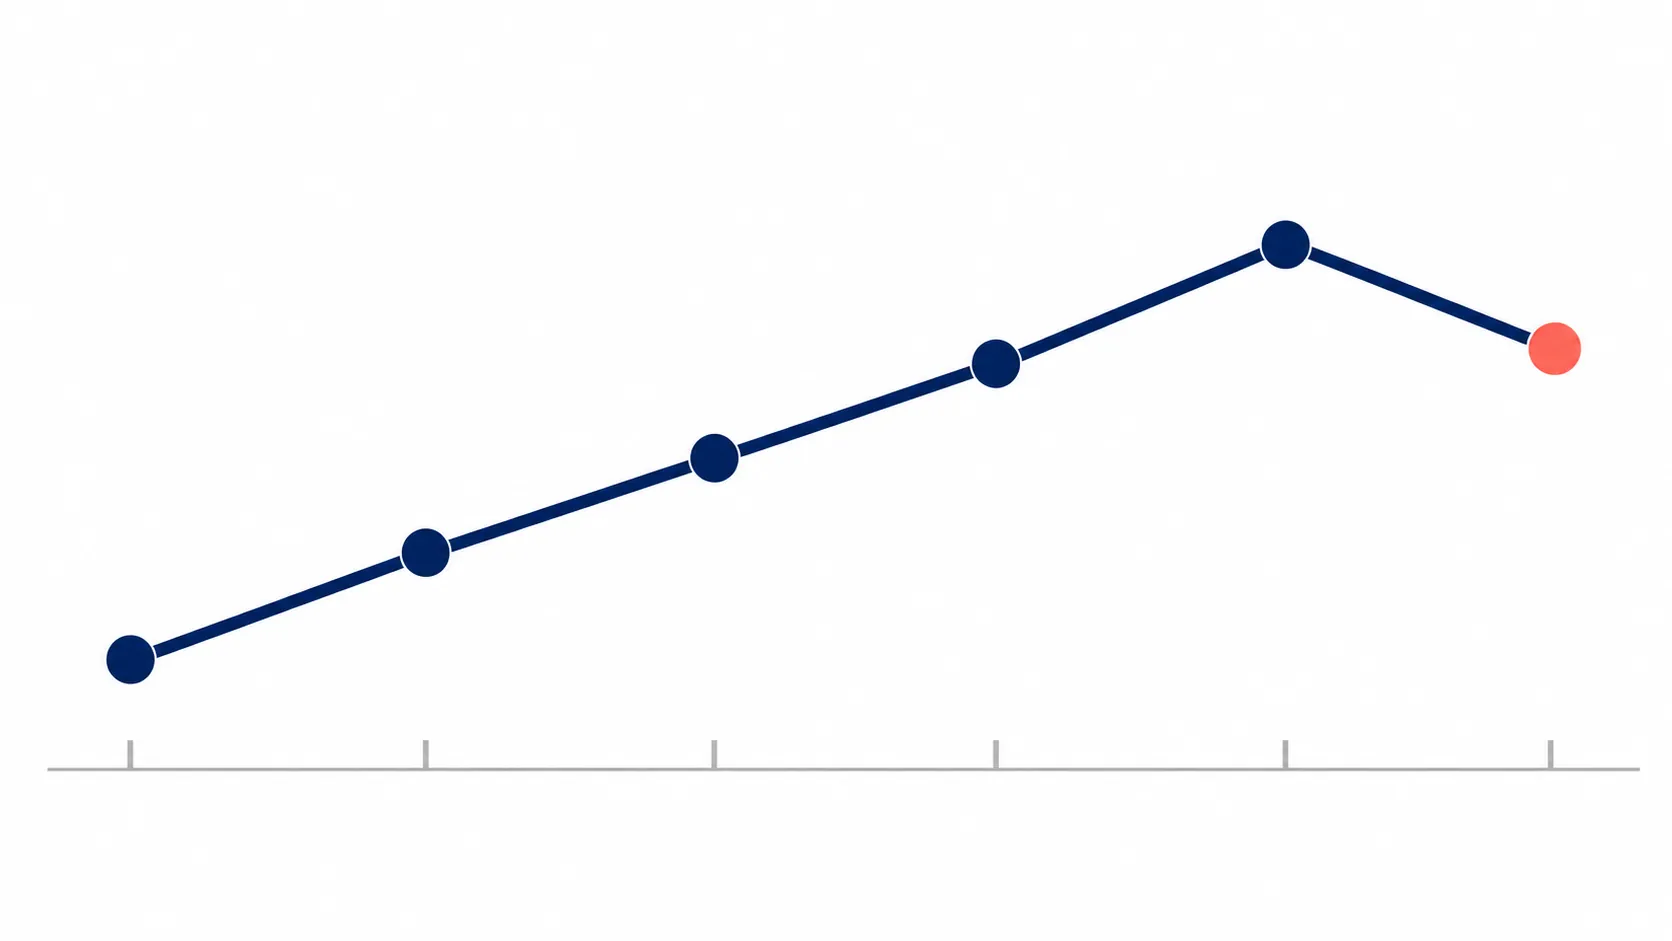
Both parts matter. The +17% tells you not to walk into a budget meeting with a doom case built only on screenshots of AI answers. The step-down tells you not to use Alphabet’s aggregate Search growth as proof that every advertiser segment is improving. Aggregate revenue can rise because of pricing, mix, query volume, auction density, international growth, retail demand, or budget migration from weaker channels. It does not certify click quality inside any one account.
For operators, the honest read is narrower and more useful: Search is not showing revenue damage at the Alphabet level, but Q2 no longer supports the easy acceleration story. If a client asks whether to cut core Search because of AI Overviews, Q2 says no. If the same client asks whether to increase Search simply because Alphabet grew Search 17%, Q2 also says no. The increment still has to earn its way through impression share, marginal CPA or ROAS, query mix, and conversion quality.
Do not let Alphabet’s profit headline leak into the media plan
The quarter also had a profit number that can distort the ads conversation if it gets repeated without the footnote. Alphabet reported net income of $112.1 billion, up 298%, and EPS of $9.11. Alphabet’s own release says those figures were inflated by a $99.0 billion unrealized gain on equity securities, mostly tied to Anthropic and SpaceX stakes, adding $77.1 billion to net income and $6.26 to EPS.[1]
That is not ad-market strength. It is an equity-marking event sitting inside the same earnings package. The revenue table is the useful document for Google Ads budgeting; the net income headline is mostly a trap door.
Capex is a better strategic signal, though still not a reason to change bids next week. Alphabet’s Q2 capex was $44.9 billion, roughly double year over year, and full-year 2026 capex guidance was raised to $195–205 billion; coverage tied that AI infrastructure spending to the roughly 4–5% after-hours stock drop.[3][4]
That pressure helps explain why automation keeps moving deeper into Google Ads. Alphabet is spending heavily to support AI infrastructure, and the ads product roadmap has to turn that infrastructure into revenue. For the related cash-flow angle, see Why Alphabet’s Negative Free Cash Flow Changes Google Ads. This piece is not a free-cash-flow argument; the budget question here starts with ad revenue, deceleration, Network weakness, and the quality of Google’s AI performance claims.
The shrinking Network line is the part to treat less casually
Google Network is the only declining ad line in the Q2 table: $7.3 billion, down about 1% year over year.[1] Digital Applied notes that this was an improvement from roughly -4% in Q1 2026, but it is still the line moving the wrong way while Search and YouTube grow.[4]
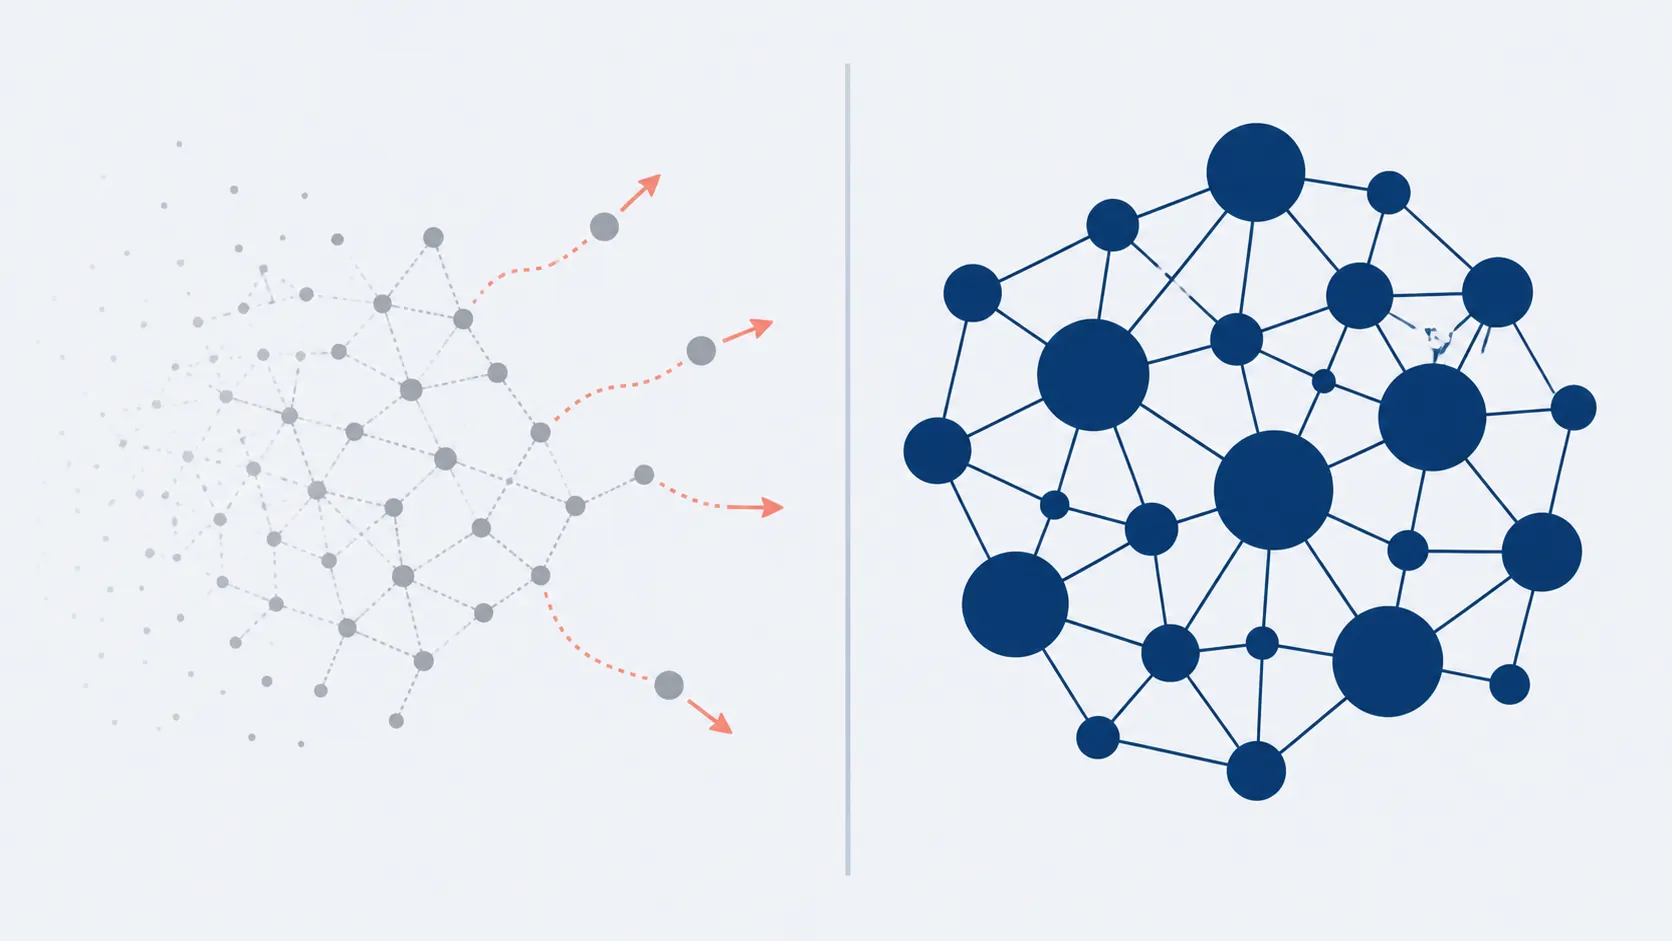
Network is not a perfect map of the open web, and one quarterly line item should not be stretched into a universal claim about publisher demand. It is still the closest revenue-side signal in this set for weaker open-web exposure. When Search is up 17%, YouTube is up 13%, and Network is down, the safer budget conversation is not “Google Ads is strong everywhere.” It is “Google-owned intent and video surfaces are holding up better than the broader Network line.”
That distinction matters inside accounts. If a plan has heavy Display Network, partner, audience expansion, or blended campaign exposure where placement quality is hard to defend, Q2 gives you less cover than it gives a high-intent Search build. The Network decline does not prove those placements will fail. It does make them the part of the plan that should carry stricter exclusions, cleaner placement review, and less tolerance for blended reporting that hides where conversions came from.
AI Max claims are a testing brief, not a budget permission slip
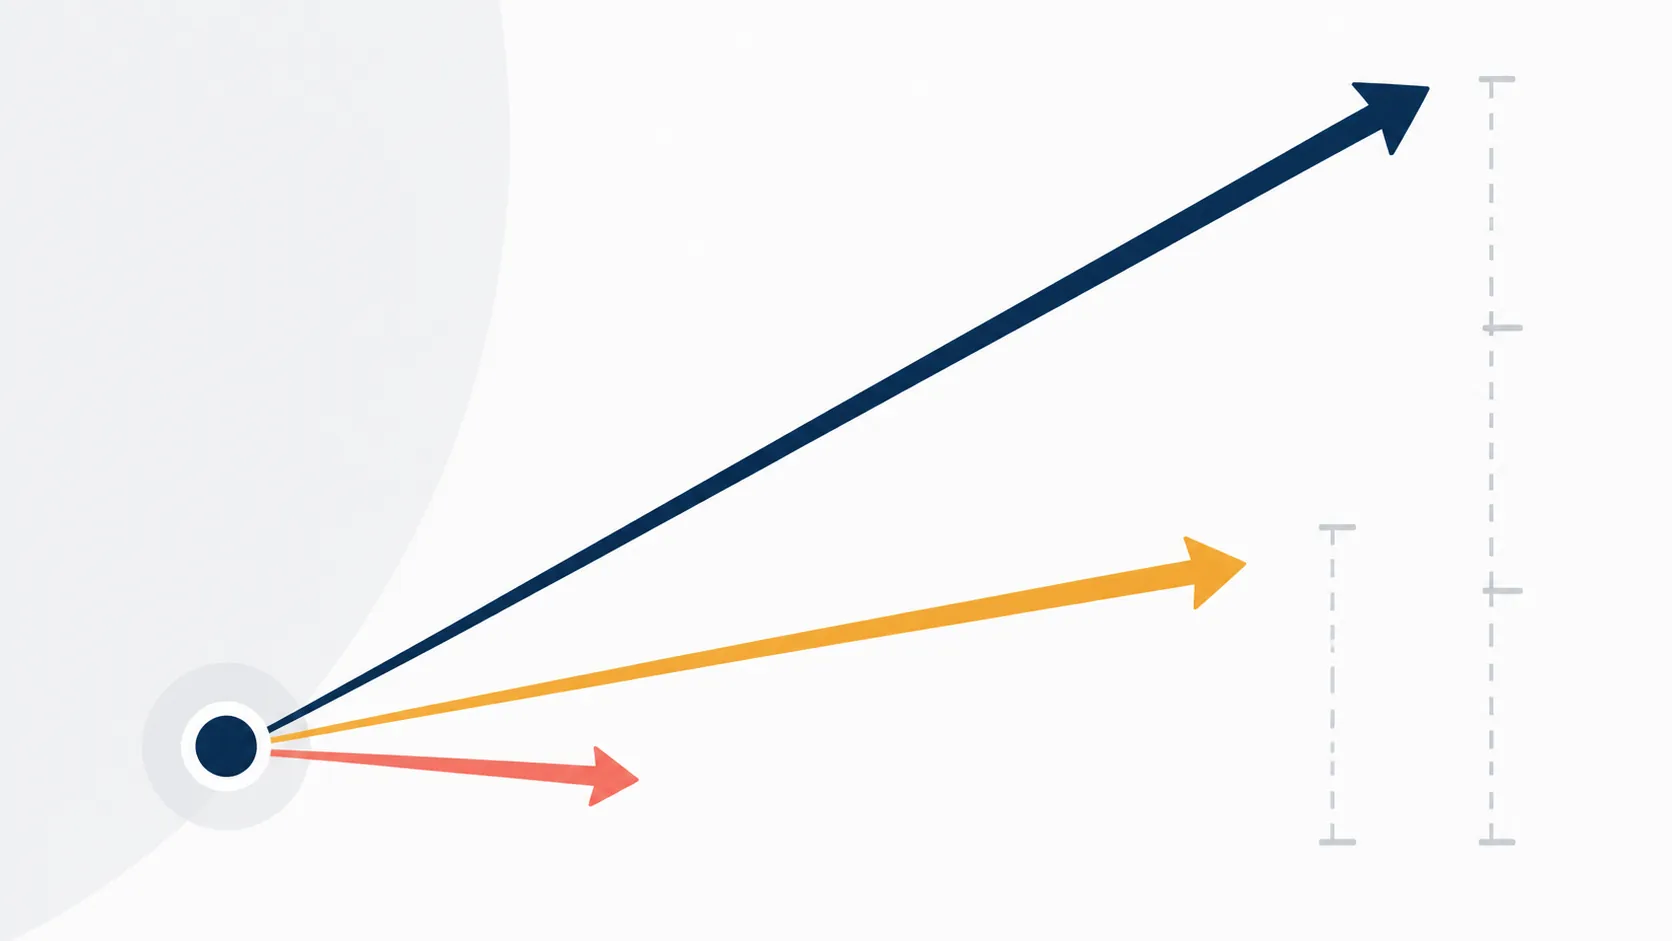
The AI Max performance story is where the operator’s job gets messier. Google’s April 15, 2026 Ads & Commerce post described AI Max as driving 7% more conversions or conversion value at a similar CPA or ROAS. Google Marketing Live 2026 coverage from Level Agency reported a 15% lift at the same ROAS. Digital Applied also flags a CNBC earnings-call live blog reference to roughly 50% more conversions, while noting that the discrepancy comes through secondhand coverage and was not independently audited in the available materials.[5][6][4]
| AI Max lift figure | Where it appears in the available materials | How to treat it in planning |
|---|---|---|
| 7% more conversions or conversion value | Google Ads & Commerce blog, Apr. 15, 2026 | Vendor-stated product benchmark; useful for deciding whether to test. |
| 15% at the same ROAS | Google Marketing Live 2026 stage data as reported by Level Agency | Vendor-stated event claim; do not blend it with the 7% figure as if they measure the same sample. |
| Roughly 50% more conversions | CNBC earnings-call live blog reference as discussed by Digital Applied | Secondhand, non-audited claim; too large to use without account replication. |
The problem is not that one of those figures must be false. The problem is that they are being used in the same product conversation without enough visible denominator: which advertisers, which campaign types, which baselines, which conversion windows, which match coverage, and which exclusions. A 7% lift can be meaningful if it comes from mature accounts with clean conversion imports. A 50% lift can be unhelpful if it comes from a narrow, underbuilt baseline. Without the test design, the number is a prompt, not evidence.
The right reaction is not blanket adoption or blanket rejection. It is tighter testing discipline. Before AI Max gets budget authority, decide which conversion action counts, whether value rules are stable, which campaign or asset group is the control, what query expansion is allowed, and what would make the test fail. If the account already has broad match, Smart Bidding, Performance Max, and dynamic creative layered together, the test has to isolate what AI Max changed instead of giving the entire automation stack credit for normal demand.
A clean test does not need theatrical precision. It needs a baseline the client accepts before the result is known. For one account, that may mean holding budget flat and watching qualified lead rate. For another, it may mean separating brand-sensitive queries from expansion. For ecommerce, it may mean judging incremental conversion value after returns or low-margin products are accounted for. The point is to keep Google’s vendor-stated lift claim from becoming the measurement system.
Q3 may look softer because the comparison gets harder
The most useful forward-looking sentence in the quarter came from CFO Anat Ashkenazi: “In Q3, we will begin lapping an acceleration in search performance that began in the third quarter last year.”[4]
That sentence belongs in any Q3 pacing discussion. If Search growth prints lower in Q3, the comparison math will be part of the story. A lower growth rate would not automatically prove AI Mode cannibalization, just as Q2’s +17% does not automatically prove AI has improved advertiser outcomes. It means the next read has to separate three things that often get collapsed into one headline: underlying Search demand, AI interface changes, and the harder year-ago base.
For budget owners, that matters because Q3–Q4 plans are usually approved before the full evidence arrives. If the plan assumes Search keeps accelerating, it is more exposed to disappointment. If the plan assumes AI has already broken Search, it ignores the current revenue line. The more defensible stance is to keep Search funded, reserve room for controlled AI Max or AI Mode tests, and make any reallocation conditional on account evidence rather than the next aggregate growth headline.
The signals worth monitoring before moving Q3–Q4 budgets
Three signals deserve more weight than Alphabet’s broad AI narrative.
- Search growth against the AI rollout timeline. If Search stays double-digit while AI Overviews and AI Mode expand, that weakens the collapse case at the revenue level. It still does not replace account-level query, CPC, and conversion analysis.
- The Google Network line. It is the weaker ad line in Q2 and the cleaner warning light for open-web exposure than the total Google Ads story.
- Account-level AI Max and AI Mode experiments. Vendor-stated lifts of 7%, 15%, or roughly 50% are reasons to design tests, not reasons to restructure spend before the account proves the lift.
Until there are durable same-site AI Max or AI Mode benchmark records, the useful comparison set is still your own account history, the Benchmarks hub, and the Tracker hub—not a product-launch average repeated across a planning deck.
So the Q2 answer is restrained. Keep Search budgets answerable to account data. Treat Alphabet’s Search growth as reassurance against the AI-collapse narrative. Treat the Network decline as the weaker part of the mix. Treat Google’s AI ad claims as invitations to run controlled tests, not as permission to move the Q3–Q4 plan on trust.
References
- “Alphabet Announces Second Quarter 2026 Results,” SEC, July 22, 2026.
- “Alphabet earnings Q2 2026,” Google, July 22, 2026.
- “YouTube Q2 2026 Ad Sales, Alphabet/Google Earnings Results,” Variety.
- “Alphabet Q2 2026 Earnings: Search Ads, AI Overviews,” Digital Applied.
- “AI Max for Search campaigns: New features,” Google, April 15, 2026.
- “Google Marketing Live 2026: What Changed and What to Do About It,” Level Agency.