
Where will midterm ad spend hit your ROAS?
The record $11.6B midterm ad cycle is a localized, calendar-predictable cost event rather than a national ROAS threat. Read where CPM pressure concentrates, what inventory stays sheltered, and how to pace Performance Max, Advantage+, and AI Max bids through the October peak and into the Q4 rebound.
- Platform
- Google Ads0 Meta Ads
- Bid strategy
- Performance Max, Advantage+0 AI Max
- Difficulty
- Moderate
- Last reviewed
- 0-07-31
Grounded in benchmark case file: Basis 2026 political ad timing ranges
The $11.6 billion midterm ad cycle is not a reason to pull back national Q4 budgets by reflex. It is a reason to stop looking at national blended ROAS as if every DMA will buy through the same auction in October. The practical read is this: midterm poll results affect political ad strategy when race movement redirects political money into specific states, weeks, and channels, and those pockets are where Performance Max, Advantage+, AI Max, and programmatic bidding can start paying more for the same user.
AdImpact’s current baseline is the June 11, 2026 revision: the firm lifted its projection for the 2026 election cycle to $11.6 billion, up $795 million from its earlier roughly $10.8 billion estimate, because the “competitive landscape evolved.” The revision added $309 million in Ohio, $288 million in Texas, and $185 million in Maine, and it raised the Senate projection from $2.8 billion to $3.4 billion.[1] That is the part that belongs in a media plan. Not the national record by itself; the state additions and the timing of when that money has to clear.
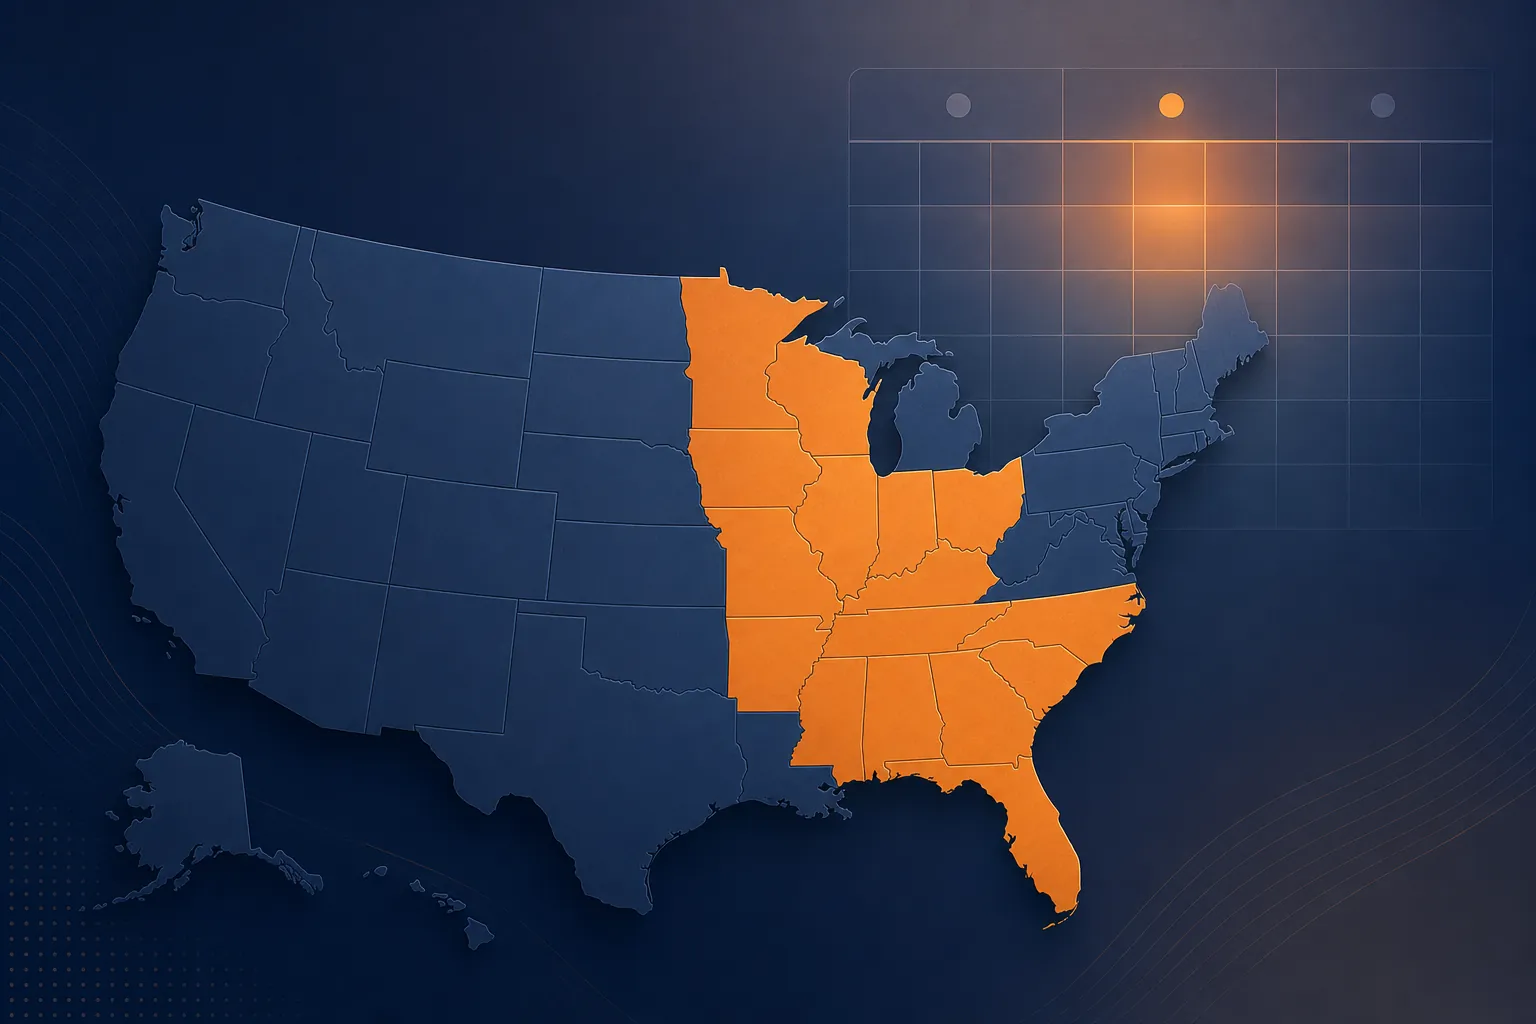
Basis puts the calendar pressure in a range most buyers can plan around: 58% to 67% of political spending lands from August through November, October alone accounts for 28% to 36%, about half of digital dollars run in the final 30 days, and about a quarter run in the final 10 days.[2] That makes the midterm a dated cost event. It is not evenly distributed across the year, and it is not evenly distributed across the country.
The national number is too blunt for a bid strategy
A national ecommerce account can look stable in the aggregate while a few exposed markets quietly damage the week. That is the ugly version of October: the national dashboard still looks explainable, but the Ohio, Michigan, Georgia, North Carolina, Texas, Maine, or other hot-market slices are buying through political demand that was not present in July.
Basis, citing AdImpact, identifies the top projected states as California at $1.1 billion, Michigan at $936 million, Georgia at $757 million, North Carolina at $669 million, and Texas at $556 million.[2] Those totals do not mean every advertiser should treat all five states the same. They mean those states deserve separate monitoring, especially when they overlap with your highest-value customer geographies.
There is also a scope problem worth keeping visible. The older $10.8 billion figure is stale next to AdImpact’s June 11 revision. Cross Screen Media’s $11.2 billion figure is not a competing all-media estimate; it is a video-ad-spending projection.[3] If a forecast deck mixes those numbers without labeling date and scope, the pacing decision underneath it is already muddy.
How poll and race movement turns into auction pressure
A poll release is not a CPM report. The materials here do not support a claim that one public poll causes one measurable CPM jump in one auction. The useful chain is narrower: polling and race-rating movement can change how campaigns, parties, and outside groups judge competitiveness; those judgments can redirect budgets; redirected budgets can concentrate in states and DMAs; concentrated budgets can raise competition for the same CTV, social, video, and display impressions a non-political buyer wants.
That chain is why dated race-rating movement matters. Inside Elections shifted nine House races toward Democrats in March 2026.[4] Cook Political Report ratings were still being updated as recently as July 30, 2026, including TX-15 and NH-02.[5] Those moves are not auction measurements. They are leading indicators for where political money may become more aggressive, especially when they line up with AdImpact’s state-level revisions.
| Signal | What it can imply | What to do in the ad account |
|---|---|---|
| AdImpact raises a state projection | More political demand is expected to clear in that state than earlier plans assumed | Add that state’s DMAs to a weekly CPM, CPC, conversion rate, and ROAS view |
| A House or Senate race moves toward toss-up or becomes newly contested | Political buyers may shift money into that race’s media markets | Watch exposed DMAs against similar non-exposed control markets before changing national budgets |
| October pacing accelerates | The auction is entering the cycle’s highest-pressure month | Tighten monitoring cadence and prepare channel shifts before the final 30-day digital compression |
| Your account shows CPM inflation without matching conversion value | The model may be buying through a distorted local auction | Reduce exposure in that DMA or inventory pocket, then verify whether efficiency recovers |
The control-market comparison matters because political pressure is easy to over-attribute. If CPMs rise everywhere, the midterm may be only one part of the story. If CPMs rise mainly in exposed DMAs, during the expected political window, and most sharply on channels that accept heavy political demand, the election calendar becomes a more credible explanation.
This is the same macro-print-to-bid-decision discipline as Why eurozone GDP growth won't change ad budgets: the headline is not the decision. The decision lives where the macro signal touches a cost surface you actually buy through.
Channel exposure: where the pressure is most likely to show up
The pressure does not hit every channel the same way. The better question is not “Will political ads raise CPMs?” but “Which inventory am I buying in which market during which week?”
CTV and online video
CTV is the channel to watch most carefully in contested markets. Basis estimates political CTV at roughly $2.4 billion to $2.7 billion, with spikes concentrated on platforms that accept political advertising, including Hulu, Roku, and YouTube. Netflix and Amazon Prime Video are comparatively sheltered because they do not carry political ads in the same way.[2]
That does not mean every CTV buy should move to Netflix or Amazon Prime Video. It means a buyer with exposed-market CTV spend should separate political-ad-accepting platforms from less-contested options in reporting. If the blended CTV line is the only view, the model can keep feeding the most distorted pocket while the account team debates why total video ROAS softened.
Social
Scale Marketing expects social CPM pressure of 5% to 15% nationwide and 40% to 50% in battleground markets during the midterm cycle.[6] That is exactly the kind of spread a national average can hide. A broad Advantage+ setup may still allocate quickly, but it is not guaranteed to understand that a local political auction is temporarily distorting the price of incremental reach.
For social buyers, the useful cut is not just state. It is state plus audience plus placement plus week. If a battleground-state audience starts paying materially more while similar non-exposed audiences hold steadier, the account has a pacing problem, not a brand-level demand problem by default.
Programmatic display, audio, and podcasts
AdWave describes political CPMs as running 20% to 40% higher from September through November.[7] Scale Marketing estimates programmatic audio and podcast CPM pressure at 10% to 20%.[6] Those ranges are not account guarantees, and they should not be used as universal benchmarks. They are useful as stress-test assumptions: if your exposed-market CPMs move into that kind of range while control markets do not, the political calendar deserves attention.
Display and audio can still be useful pressure valves when CTV and social are crowded, but only if the account verifies incrementality and conversion quality. Shifting inventory is a pacing tactic, not a promise that ROAS comes back automatically.
Search
Search is less directly exposed in the available guidance. Scale Marketing describes search impact as limited.[6] That does not make search immune to everything happening around it; it means the political-auction story is more persuasive for video, CTV, social, and programmatic than for query-driven demand.

Brand-safety data belongs in the plan, with a caveat
Basis, citing Integral Ad Science, says 75% of consumers view brands less favorably when ads appear near misinformation, and that ads avoiding risky political content see 32% lower cost per conversion.[2] Because those IAS figures are secondhand in the available material, they should be treated as a planning caution rather than an independently verified benchmark inside this article.
The operational point is still simple: in October, cheap reach around political or misinformation-heavy content may not be cheap after conversion quality and brand risk are counted. Exclusion lists, suitability controls, publisher reporting, and post-click quality checks deserve more attention in the final stretch than they usually get in a routine Q4 scale plan.
How to pace Performance Max, Advantage+, and AI Max through the midterm
Automation can reallocate faster than a human buyer. It can also keep spending into a distorted local auction if nobody gives it a reason not to. The goal is not to outguess every model decision by hand. The goal is to create enough location, channel, and calendar visibility that the team can see when the model is buying political scarcity instead of profitable demand.
Build the exposed-market view before October
Start with the states already identified by the spend forecasts and revisions: the top projected states from Basis, plus the state-level additions in AdImpact’s June update. Then add any DMAs where your own revenue concentration is high. The point is not to create a political map. It is to create an account map where a CPM shock would actually matter.
- For Performance Max and AI Max: export location performance by DMA or the most granular available market cut, then compare CPM, CPC, conversion rate, average order value, conversion value, and ROAS against non-exposed markets.
- For Advantage+: avoid relying only on the national campaign total. Pull delivery and efficiency by state or DMA where reporting allows, and check whether broad delivery is drifting toward expensive contested markets.
- For programmatic and CTV: split reporting by platform, exchange, publisher group, device, and market. A CTV average that combines political-ad-heavy and political-ad-light environments is not actionable.
- For search: monitor exposed markets, but do not force a political explanation unless query-level demand and cost data support it.
Use control markets, not vibes
Pick a small set of non-exposed or less-exposed markets that look similar enough to be useful: comparable historical ROAS, similar seasonality, similar product mix, and enough volume to read. During September and October, compare exposed-market movement against those controls weekly, then more frequently in the final 30 days.
If exposed markets show CPM inflation while control markets are stable, and conversion value does not keep up, pace down locally before cutting the national budget. If both exposed and control markets deteriorate, the election may be noise on top of a broader Q4, offer, creative, or demand issue. The account needs that distinction before anyone rewrites the quarter.
Give the models narrower choices when the auction gets noisy
When October pressure shows up, the first move is usually not a national budget cut. It is a narrower set of constraints: reduce exposed-market budgets, adjust targets where the platform supports it, separate high-pressure markets into their own campaigns or ad sets when scale justifies the extra structure, and shift incremental tests toward less-contested inventory.
On Performance Max and AI Max, that may mean isolating the worst-performing exposed geographies if they are large enough to manage separately, watching whether asset groups or final URL paths are being pulled into lower-quality inventory, and avoiding major learning resets in the final 10 days unless the account is already bleeding. On Advantage+, it may mean separating a high-pressure state cluster from the national ad set, applying stricter cost controls where available, or using budget rules that prevent a broad model from chasing volume in the wrong market.
The verification habit should look familiar if you already use Signal & Convert’s AI infrastructure cost-surface checklist or the HBM4 CPM leading-indicator benchmark. A leading indicator earns attention only when it lines up with observed account movement.
The Q3–Q4 action calendar
The calendar below is anchored to the Basis timing ranges: August through November carries most political spend, October is the peak month, and digital compresses heavily into the final 30 and final 10 days.[2] Use it as a monitoring cadence, not as a promise that every market follows the same curve.
| Window | What is happening | Buyer action |
|---|---|---|
| Now through August 2026 | Baseline period before the heaviest political compression | Build the exposed-market list; tag top states, revised states, and high-revenue DMAs; set control markets; save July and August CPM/ROAS baselines |
| September 2026 | Political demand becomes more visible across contested markets | Review exposed vs. control markets weekly; separate CTV, social, programmatic, audio, display, and search instead of relying on blended paid media totals |
| October 2026 | Peak political-spend month | Move to tighter pacing in exposed DMAs; reduce waste in political-ad-heavy inventory; test less-contested CTV, audio, display, CRM, and owned-channel support where performance data allows |
| Final 30 days | Roughly half of digital political dollars are expected to run in this window | Increase monitoring cadence; avoid broad national budget cuts unless the weakness is national; protect learning stability unless local losses are already clear |
| Final 10 days | The most compressed digital stretch | Use daily checks for exposed-market CPM, CPC, conversion value, and ROAS; pause or cap only the market-channel pockets that are failing against controls |
| November–December 2026 | Political pressure should begin clearing after the election window | Reopen spend gradually in markets where CPM and ROAS normalize; compare the rebound against the site’s dated Tracker records and your own account logs |
The rebound matters. If October forced local pacing down, November and December are where the account should look for normalized CPMs and re-expanded budgets. Do not assume the rebound nationally; verify it by DMA and channel. The same posture applies to Signal & Convert’s dated Tracker records: a timeline is useful because it can be checked against actual movement, not because it makes the decision for the buyer.
Watch race-rating moves and spend revisions as leading indicators. Compare actual account CPM and ROAS by DMA, channel, and week. Shift budget away from distorted pockets when the data supports it. Do not rewrite the entire national Q4 plan because a localized October auction got loud.
References
- AdImpact Reveals 2026 Election Cycle to Reach Record $11.6 Billion in Ad Spending, AdImpact, June 11, 2026
- How Political Advertising Will Impact the Media Landscape in 2026, Basis
- Video Ad Spending to Set Record in 2026, Campaigns & Elections
- House midterm elections ratings changes benefit Democrats, Roll Call, March 18, 2026
- 2026 House Race Ratings, The Cook Political Report, July 30, 2026
- The State of Media in 2026: Navigating a Midterm Election, Scale Marketing
- Programmatic Political Advertising, AdWave