
Why SK Hynix's $500 memory chips are raising your CPMs
SK Hynix's HBM4 memory chips, pre-sold for 2026 at ~$500 per stack, are structurally inflating Meta CPMs. Media buyers can use SK Hynix earnings disclosures as a leading indicator to anticipate cost changes 1–2 quarters before they hit their dashboards.
- Platform
- Meta Ads
- Campaign type
- Advantage+
- Spend range
- Various
- Timeframe
- Feb 0 - Apr 2026
- ROAS
- 0x
- Verdict
- loss
- Industry vertical
- ecommerce
- Last reviewed
- 0-07-29
A roughly $500 HBM4 stack is not a semiconductor footnote if you buy Meta ads for a living. It is one of the cleaner upstream numbers in the chain now sitting under 2026 CPM pressure: SK Hynix HBM4 pricing moved from the roughly $300-per-stack HBM3E range to roughly $500 per stack, a 67% generational increase, while SK Hynix holds an estimated 50–55% share of the HBM market.[1] The practical question is not whether one chipmaker personally raised your CPM. It is whether memory pricing has become large enough, constrained enough, and visible early enough to treat as a warning signal before the change shows up in Ads Manager.

The compressed chain looks like this: SK Hynix sells scarce HBM into AI infrastructure at record pricing; DRAM and memory prices rise more broadly; GPU and server packages get more expensive; Meta raises capital expenditure guidance while citing higher component pricing; Meta’s average price per ad rises; then buyers see higher CPMs and weaker ROAS in account-level data. Each link is imperfect. Together, they are harder to dismiss than the usual platform-side answer that everything is just auction competition.
The strongest public phrase in the chain came from Meta CFO Susan Li in April 2026, when Meta raised its 2026 capex outlook and cited “higher component pricing” for semiconductor and memory chips as a driver of a $10 billion guidance increase.[2] That is not a confession that SK Hynix HBM pricing flows one-for-one into your prospecting CPM. It is, however, direct evidence that the infrastructure bill behind Meta’s AI systems is moving because components are more expensive.
The Pass-Through Chain, With Dates Attached
The useful version of this story is dated. Without dates, “AI is making ads expensive” becomes another foggy explanation that helps nobody defend a forecast.
| Link in the chain | What the public signal says | Why a media buyer should care |
|---|---|---|
| SK Hynix HBM pricing | HBM4 is estimated at roughly $500 per stack, up from roughly $300 for HBM3E.[1] | The input cost is not marginal when memory is a major part of AI accelerator packages. |
| Supply constraint | SK Hynix said in October 2025 that its 2026 production was already customer-contracted, with parallel sold-out commentary from Micron reported in January 2026.[3] | A sold-out supply year gives platforms less room to wait for cheaper capacity. |
| DRAM inflation | Market reporting in early 2026 pointed to sharp DRAM price pressure tied to AI memory demand.[3] | The shortage is broader than one premium part number. |
| GPU and server package cost | Memory was reported as more than half of the cost of some GPU packages in the shortage environment.[4] | If memory is half the package, memory pricing can move the infrastructure budget. |
| Meta capex guidance | Meta lifted 2026 capex guidance to the $125–145 billion range while component pricing was called out as a pressure point.[2][5] | The platform is telling investors its infrastructure cost floor is rising. |
| Ad-price movement | Meta’s average price per ad rose 12% in Q1 2026 while impressions rose 19%.[5] | Buyers are not imagining price pressure; it is visible in platform-level monetization. |
| Portfolio-level buyer pain | Common Thread Collective reported Meta acquisition ROAS down 39% and CAC up 31% from February 2024 to April 2026 across 230+ DTC brands.[6] | The downstream impact resembles what ecommerce operators are seeing, though the sample is DTC-heavy. |
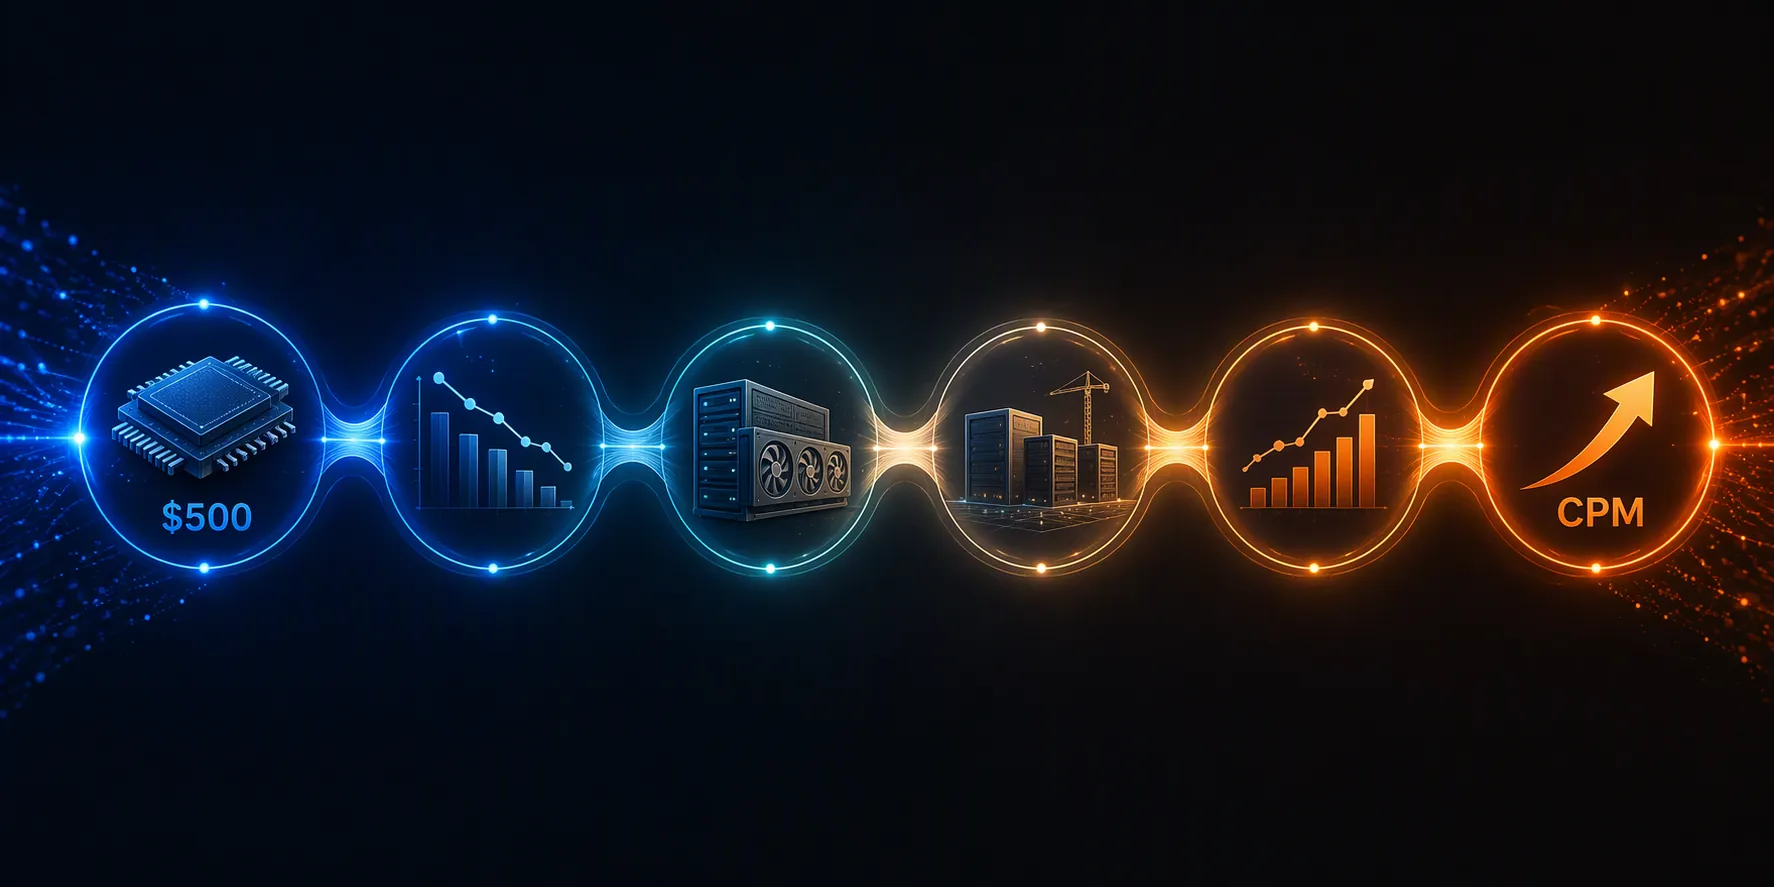
The chain does not require pretending that Meta runs a simple cost-plus ad auction. Meta still prices ads through auction dynamics, advertiser demand, targeting quality, user supply, and monetization strategy. But when the company is spending tens of billions more on AI infrastructure and tells investors that component pricing is one reason, the cost base behind the auction has changed.
That distinction matters on a weekly performance call. A founder may still want to hear that the new hook, landing page, or offer will fix the blended CAC line. Sometimes it will. But if CPMs are up 13–20% year over year across comparable accounts, the first explanation should not always be creative fatigue or poor account hygiene. Common Thread Collective’s May 2026 read across more than 230 DTC brands put Meta CPM increases in that range and reported acquisition ROAS falling from 2.57x to 1.56x between February 2024 and April 2026.[6] That does not describe SaaS, B2B, or lead generation as a whole. It does describe a market where many ecommerce buyers are paying more for the same opportunity to be seen.
Why The SK Hynix Signal Leads The Dashboard
The reason SK Hynix earnings are operationally interesting is timing. A chip contract is visible before a server fleet is deployed. A capex guide changes before the full depreciation, data-center, and model-serving burden is reflected in platform economics. A buyer’s CPM dashboard usually sees the consequence after the platform has already absorbed, financed, or priced around the infrastructure decision.
SK Hynix’s October 2025 statement that 2026 RAM production was already customer-contracted was an early constraint signal.[3] By early 2026, broader reporting pointed to an AI memory shortage, sold-out supply, and an unusual pricing surge.[3] In April, Meta raised capex guidance and pointed to higher component pricing.[2] In Q1 2026, Meta’s average price per ad was up 12%.[5] By May, DTC portfolio operators were publishing deteriorating CPM, CAC, and ROAS data.[6]
That sequence is not a validated formula. It is a usable lead-lag pattern. The observed 2025–2026 sequence suggests a one-to-two-quarter window between memory-market stress becoming obvious in supplier and platform disclosures and buyers seeing enough pressure in campaign data to need a new forecast conversation. The lag could stretch or compress depending on inventory, contract timing, model rollout, advertiser demand, and how aggressively Meta chooses to monetize AI improvements.
The clean operating move is to watch SK Hynix only as the first screen, not as the trigger. If HBM pricing rises but Meta capex guidance is stable and your own category CPMs are flat, the signal is incomplete. If SK Hynix pricing tightens, Meta raises capex again, and your Benchmarks view shows CPMs moving faster than conversion rate can offset, then the conversation changes from “fix the ads” to “reset the efficiency range.”
For portfolio context, the related Signal & Convert tracker on AI infrastructure tax and ad costs follows the broader electricity, server, and data-center layer. The complementary benchmarks piece on Nvidia infrastructure costs and programmatic CPMs is useful when the same memory-cost logic starts showing up outside Meta.
The $500 Stack Is Only One Part Of The Memory Squeeze
HBM gets attention because it sits close to AI accelerators, and because SK Hynix has been unusually strong in that market. But the shortage story is not limited to one premium AI memory part. CNBC’s January 2026 reporting described an AI-driven memory shortage and sold-out 2026 supply signals, while broader market coverage pointed to DRAM prices rising sharply into 2026.[3] IEEE Spectrum also described how the memory shortage reached beyond AI accelerators into the wider DRAM market.[4]
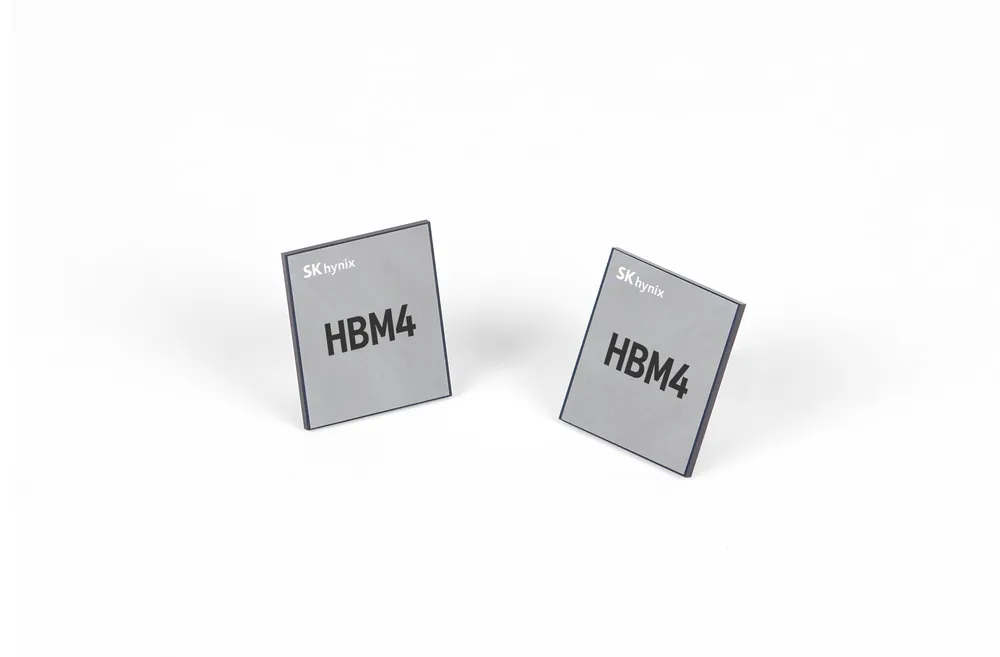
This is the part that makes the signal more relevant for ad platforms. If memory were only an isolated line item in a tiny slice of high-end AI hardware, a media buyer could safely ignore it. But when memory represents more than half of some GPU package costs in the shortage environment, and when commodity DRAM inflation begins affecting laptops, servers, and data-center buyers, the cost pressure is no longer neatly contained.[4]
The IAB warned in April 2025 that higher CPMs were likely as infrastructure costs trickled down through the ad-tech system.[7] That warning was broad. It included energy and economic uncertainty, not only HBM. Its value is that it framed pass-through before the 2026 memory numbers made the mechanism easier to trace.
The June 2026 pricing signal is also worth keeping on the sheet. Silicon Analysts reported HBM3E contract pricing up about 20% quarter over quarter in June 2026.[1] If that pressure persists, it would not be surprising to see another wave of platform infrastructure cost pressure reach ad economics later in 2026 or into early 2027. That is a watch item, not a CPM forecast.
What Meta’s 12% Ad-Price Increase Does And Does Not Prove
Meta’s Q1 2026 numbers are the hinge between infrastructure cost and buyer experience. Average price per ad rose 12%, while ad impressions rose 19%.[5] The impression growth matters because it shows Meta was not simply rationing a shrinking supply of ad opportunities. The price increase happened alongside more impressions, which is consistent with stronger monetization, stronger demand, improved targeting, and some degree of cost pressure moving through the business.
Public data cannot split that 12% into tidy buckets. Some of it may reflect AI-driven ranking and targeting improvements that make ads more valuable to advertisers. Some may reflect auction competition from brands still willing to pay for Meta’s conversion signal. Some may reflect the infrastructure burden of training, serving, and iterating those AI systems. Treating the whole 12% as a memory-chip tax would be lazy. Treating none of it as infrastructure-related would also ignore what Meta told investors about component pricing.
The buyer-side data lands after that. Common Thread Collective’s DTC portfolio showed acquisition ROAS down 39%, from 2.57x to 1.56x, and CAC up 31%, from $40.27 to $52.86, between February 2024 and April 2026.[6] Those figures are useful because they resemble the pain operators are trying to explain: the same budget buys less efficient growth, even before every account-level issue is solved.
They are not a universal benchmark. A DTC-heavy sample overrepresents ecommerce seasonality, offer sensitivity, landing-page economics, and Meta dependence. A B2B advertiser with long sales cycles, a SaaS company optimizing to pipeline, or a lead-gen shop buying across search and social should not paste those ROAS and CAC changes into a board deck as market truth. The value is directional: when platform-level ad prices rise and DTC portfolio CPMs rise afterward, upstream cost pressure deserves a place in the variance explanation.
How To Use SK Hynix Earnings Without Overreacting
A media buyer does not need to become a chip analyst. The job is to build an early-warning route that is disciplined enough to keep false alarms out of the forecast.
- Track SK Hynix HBM pricing, contracted supply commentary, and management language about AI memory demand each earnings cycle.
- Check whether Micron, Samsung, TrendForce-style market reporting, or broader DRAM coverage confirms that the pressure is market-wide rather than vendor-specific.
- Wait for platform confirmation: Meta capex guidance, CFO commentary, AI infrastructure spending plans, or explicit component-pricing language.
- Compare the timing against your own CPM benchmarks by account, market, placement mix, and optimization event.
- Change budget pacing or client expectations only when upstream pressure and account-level movement point in the same direction.
The mistake is to turn SK Hynix into a magic CPM dial. If a brand’s CPM rises in one week, HBM pricing is almost never the first explanation. Check the obvious: seasonal competition, audience overlap, promo calendar, creative frequency, bid strategy, attribution window changes, catalog health, and conversion event stability. Upstream infrastructure cost explains the floor moving over quarters, not every spike in a seven-day view.
The opposite mistake is to ignore the floor because it lives outside Ads Manager. Platform release notes tell you what the interface is doing. Earnings calls tell you what the business is paying to keep the system running. In 2026, both matter.
A practical forecast note might read like this: “Meta CPMs are running 16% above last year in our account set. Creative fatigue and promo mix explain part of the variance, but Meta’s Q1 average ad price rose 12%, Meta raised 2026 capex guidance citing higher component pricing, and HBM supply remains constrained. We are treating this as a higher market floor, not only an account-performance issue.” That is defensible. “SK Hynix raised our CPMs 16%” is not.
The Operating Rule For Q3 2026
As of Q3 2026, SK Hynix earnings and HBM pricing are worth watching because they can arrive before the ad dashboard fully reprices. The signal is strongest when three things line up: constrained HBM supply, rising platform capex guidance tied to component costs, and your own CPM benchmarks moving above normal variance.
Do not act on SK Hynix alone. Pair it with Meta’s capex guidance and your own portfolio data before changing forecasts, pacing, or client expectations. That is the useful level of confidence: not perfect causality, and not a shrug.
References
- HBM Pricing & Market Share 2026, Silicon Analysts
- SK Hynix record Q1 profit, memory price climb, CNBC, Apr 23, 2026
- AI memory sold out, unprecedented price surge, CNBC, Jan 10, 2026
- How and When the Memory Chip Shortage Will End, IEEE Spectrum, Feb 2026
- Big Tech's $725B AI Capex in 2026, Value Add VC, May 2026
- Meta CPMs Are About to Spike, Common Thread Collective, May 2026
- Ad Tech Economic Uncertainty, Energy Costs, IAB, Apr 2025
Built on this evidence
No Bidding tactic or Creative record currently cites this case file. Compare it against other results in Benchmarks.
Related benchmark reading
Report a corroborating or contradicting result
Seeing something different in your own account? Feed the data-integrity loop instead of leaving an open comment.