
Are AI data center energy costs inflating ad budgets?
AI data center energy costs reach ad budgets through four transmission paths, not one energy line item — and while the macro cost data is measurable, no platform has disclosed an energy pass-through inside auction pricing. Media buyers can use this measured-versus-claimed breakdown and per-path monitoring checklist to tell a real cost driver from AI hype.
- Platform
- Google Ads
- Bid strategy
- Smart Bidding
- Difficulty
- moderate
- Last reviewed
- 0-08-27
Grounded in benchmark case file: MRS Digital April 2026 Google Ads CPC increase report
As of August 27, 2026, the defensible answer is narrow: the AI data center energy and capital-spending boom is measurable, but its impact on ad budgets is not traceable to a disclosed energy surcharge in Google, Meta, or Microsoft auction pricing. Electricity demand and infrastructure investment are rising at a scale that could create cost pressure. No public platform disclosure, however, shows how much of a campaign’s CPC, CPM, or platform fee reflects that pressure.[1][2]
That distinction matters when a finance lead asks why media is getting more expensive. Four different transmission pipes are often compressed into one claim about “expensive AI.” Their evidence is not interchangeable.
| Transmission pipe | Cost evidence available | Proposed route into ad spend | Observable account signal | What remains inference |
|---|---|---|---|---|
| Adtech infrastructure cost per bid | A Servers.com vendor case pattern reports bid volume rising 20% while infrastructure cost rose 40%; it also identifies metered network charges on dropped bids.[3] | An adtech or cloud operator absorbs the higher cost, raises fees, changes contracts, reduces service, or passes the expense to customers. | Cost per bid request, vendor invoice changes, bid loss, latency, or a separately stated technology fee. | Whether this vendor pattern applies to a buyer’s stack or affects walled-garden CPCs and CPMs. |
| Electricity-rate pass-through | The IEA projects steep growth in data center electricity demand; PJM capacity prices also rose sharply across dated auctions.[1][4] | Power-market costs reach a data center, cloud provider, adtech vendor, or platform and are then recovered commercially. | Applicable utility, hosting, cloud, or vendor-contract changes; usually no direct Google Ads or Meta account field. | How much of a regional power-market increase reaches a particular advertising product. |
| Platform margin recovery | Large AI investment is documented, while advertiser recovery is proposed by industry commentators and forecast by IAB.[1][2][5] | A platform protects margins through fees, auction design, product packaging, or pricing that is not itemized by cost input. | A disclosed fee, contract change, take-rate change, or platform statement. None currently identifies an energy component. | That movements in CPC or CPM represent recovery of AI electricity or capex rather than competition, demand, product mix, or other costs. |
| AI-driven auction mechanics | MRS Digital reports a 36%–40% year-over-year CPC increase in client Google Ads data and attributes it to inventory compression and automation effects.[6] | AI Overviews alter available inventory while Smart Bidding and broad match change participation, bids, and query coverage. | CPC, impression share, query mix, match-type expansion, auction competition, placement mix, and bid-strategy behavior. | Whether energy or data center capex caused any observed auction movement. |
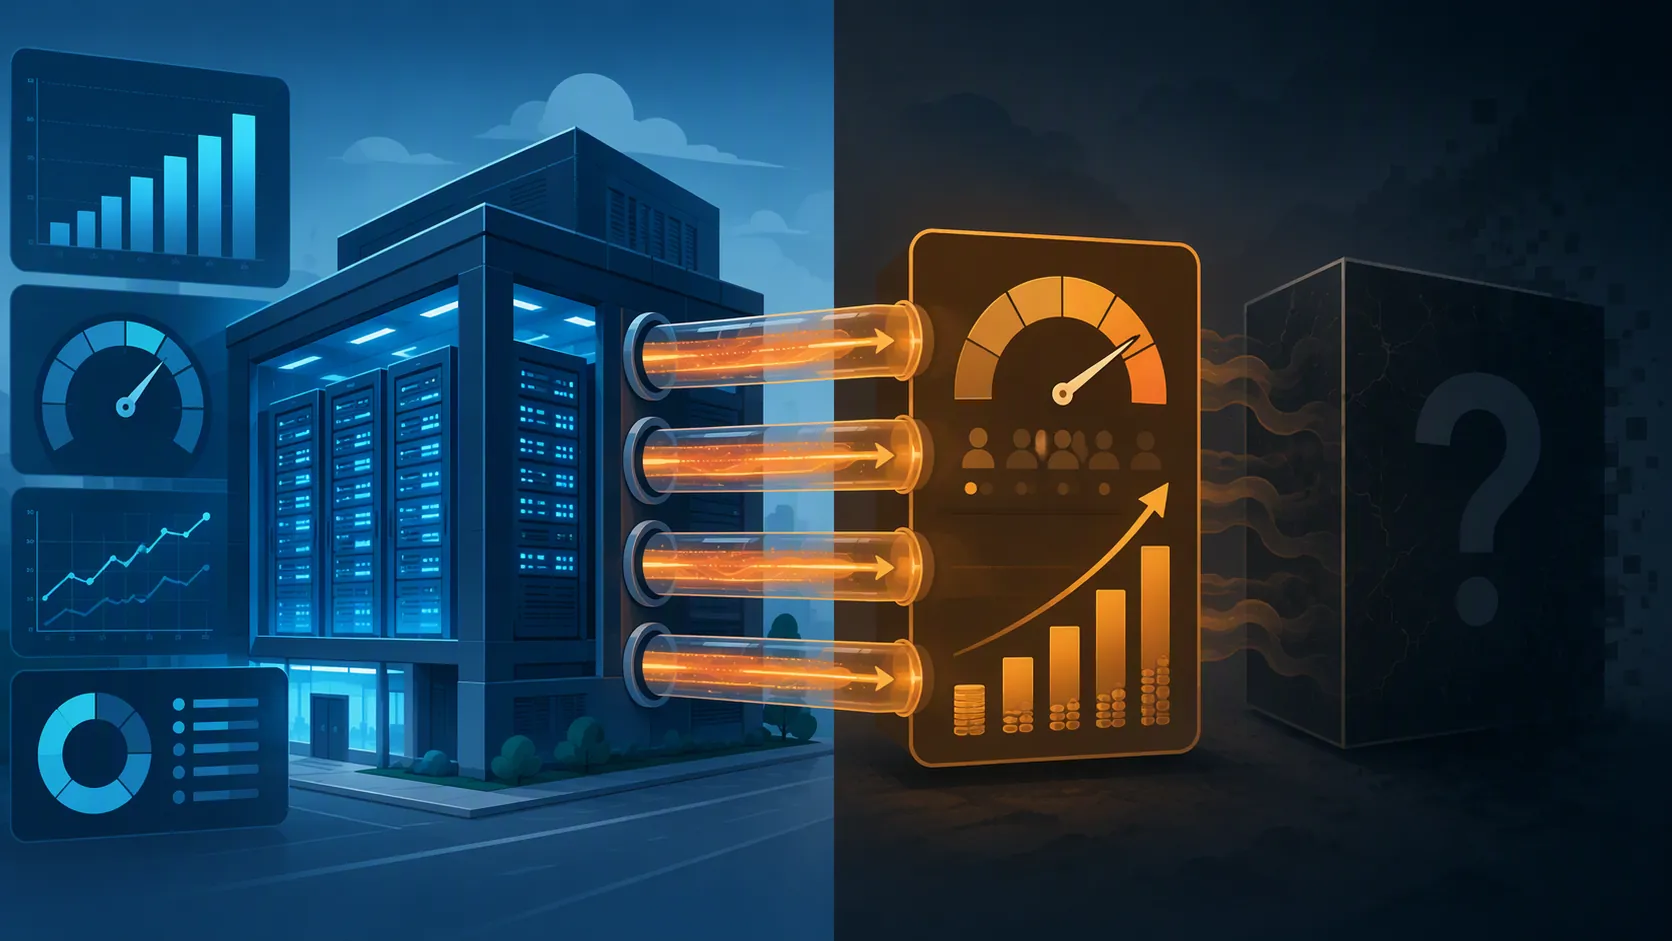
The cost boom is real; the handoff to campaigns is not documented
The IEA estimates that data center electricity consumption will rise from roughly 485 terawatt-hours in 2025 to about 950 terawatt-hours in 2030, when it would represent approximately 3% of global electricity demand. Electricity consumption by AI-focused data centers increased by more than 50% in 2025. The same IEA report says five major technology companies invested more than $400 billion in 2025 and were expected to increase capital expenditure by about 75% in 2026.[1]
Those figures establish scale and direction. They do not establish how a dollar spent on power equipment, chips, cooling, transmission, or construction enters an individual advertising auction. Between the cost base and the advertiser sit utilities, data center operators, cloud providers, adtech vendors, platforms, product teams, pricing policies, and competing bidders. A credible pass-through claim has to identify which participant paid the cost, who recovered it, when the recovery began, and where it became observable.
That is why the useful question is not whether AI infrastructure is expensive. It plainly is. The useful question is which pipe could carry that expense into a specific media bill—and whether evidence exists at both ends of the pipe.
Infrastructure cost per bid has the clearest operating mechanism
The shortest route appears in infrastructure operated directly for bidding. Every request consumes some combination of compute, networking, storage, observability, and engineering capacity. If the system evaluates more requests without producing proportionate revenue, its cost per useful bid can rise even when the cost of any one server does not.
A July 2026 Servers.com article presents a case pattern in which bid volume increased 20% while infrastructure cost increased 40%. It also points to AWS NAT Gateway data processing billed at $0.045 per gigabyte and notes that dropped bids can still incur infrastructure charges.[3] This is vendor-published operational evidence, not an independent market benchmark, but the mechanism is concrete: requests consume resources before the platform knows whether they will become bids, wins, impressions, or revenue.
For an advertiser using a demand-side platform or intermediary, that pressure could appear in a technology fee, a revised contract, usage pricing, minimum commitments, or service changes. It may also remain inside the vendor’s margin. The relevant account-level measure is therefore not CPC alone. It is cost per processed opportunity or bid, reconciled against requests, submitted bids, wins, impressions, and separately invoiced technology costs.
This evidence cannot be carried across to Google Ads, Meta, or Microsoft by analogy. A third-party adtech operator’s network bill demonstrates that bidding infrastructure has costs. It does not reveal the internal cost allocation or pricing policy of a walled garden.
Electricity markets create pressure before anyone decides who pays
Regional electricity evidence sits farther upstream. In July 2025, the Institute for Energy Economics and Financial Analysis reported that PJM capacity prices moved from $28.92 per megawatt-day for the 2024/25 delivery year to $329.17 per megawatt-day for 2026/27. It also reported the PJM market monitor’s finding that data centers accounted for 63% of the increase in the 2025/26 auction, or approximately $9.3 billion.[4]
That is meaningful evidence of a power-market cost channel, but it comes with an important qualification. IEEFA argues that the clearing price rests partly on data center load forecasts extending over 20 years that may be inflated. The auction priced expected demand and resource adequacy under those forecasts; it did not wait for all forecast demand to materialize.[4]
A media buyer still cannot apply the PJM increase as a multiplier to a campaign. The platform may operate in multiple power markets, hedge electricity purchases, contract directly for generation, own facilities, buy cloud capacity, or absorb the expense. Even if a supplier’s bill rises, commercial pass-through may be delayed, partial, bundled with other costs, or absent.
Electricity-market evidence becomes relevant to an account only when the chain acquires another dated link: an applicable hosting invoice, cloud-rate change, vendor contract revision, platform disclosure, or other document connecting the market to the service being purchased. Without that link, the PJM result is a risk indicator rather than campaign attribution.
Platform margin recovery is the least visible pipe
The commercial argument is straightforward: companies making enormous AI investments will eventually seek revenue or margin sufficient to justify them. The Current cited a Bain estimate that roughly $2 trillion in new annual revenue would be needed by 2030 and presented the Check My Ads Institute’s view that platform costs are “baked together” in fees advertisers cannot independently inspect.[2]
That is expert interpretation of platform economics, not a measurement of energy recovery in ad pricing. IAB similarly wrote in April 2025 that cloud and data center expenses “may pass through” and that “higher CPMs are likely.” The modal language matters: this was a forecast about possible pricing pressure, not evidence that a pass-through had occurred.[5]
Walled-garden opacity makes the hypothesis difficult to test. An advertiser observes the clearing result and campaign charge, not the platform’s internal allocation among electricity, depreciation, AI model development, traffic acquisition, safety, sales, and profit. Rising CPM can be consistent with margin recovery, but it is also consistent with stronger advertiser demand, scarcer inventory, audience changes, seasonality, altered ranking rules, or a different placement mix.
The absence of a disclosed energy line does not prove platforms are absorbing every cost. It also does not prove they are concealing a surcharge. It leaves the amount unmeasured. The dated CoreWeave debt tracker and Microsoft AI data center spend tracker preserve the appropriate status: there is a documented investment trail, but no proven CPC causation.
Auction inflation can happen without energy-cost pass-through
The fourth pipe is commonly mistaken for the first three because both carry the AI label. AI can change auction outcomes through inventory, targeting, matching, bidding, and participant behavior even if no energy expense is passed through.
In April 2026, MRS Digital reported year-over-year Google Ads CPC increases of 36%–40% in its client data. The agency attributed the movement to AI Overviews compressing available paid-search inventory, Smart Bidding automation creating more aggressive competition, and broad match expanding advertisers into additional queries.[6]
This is a dated agency observation with a proposed auction-level explanation. It is not a platform-wide benchmark, and the attribution does not isolate the contribution of each mechanism. It does not identify electricity or capital expenditure as a cause. No applicable named-account Benchmarks record is available to validate the reported CPC range against primary campaign data.
The distinction changes the diagnosis. If CPC rises while query coverage broadens, impression share shifts, match-type composition changes, or a bid strategy enters more expensive auctions, the first investigation belongs inside auction mechanics. A macro electricity chart cannot explain those account events. Conversely, a vendor invoice increase could establish infrastructure pass-through even if campaign CPC remains flat.
The existing audit of AI mechanisms affecting digital ad costs is useful for examining automation and inventory changes. The energy question requires an additional test: whether the cost base can be followed through an identified commercial route rather than inferred from the presence of AI in both the data center and the auction.

Keep four dated evidence logs, not one AI narrative
Monitoring works only if the pipes remain separate. Each log entry should record the original source date, the affected entity or market, the proposed transmission mechanism, the first observable account signal, and at least one competing explanation. An undated chart or a forecast detached from the relevant platform should not trigger a bidding change.
Infrastructure cost per bid
- Record monthly infrastructure or vendor cost against bid requests, submitted bids, wins, impressions, and revenue—not only media spend.
- Separate compute, network egress, gateways, storage, observability, and managed-service fees where invoices permit.
- Date contract changes and verify whether a higher fee applies to all activity, a particular region, or a specific service.
- Do not classify an external vendor’s cost pattern as evidence about Google, Meta, or Microsoft unless a platform-specific disclosure supplies the missing link.
Electricity-market exposure
- Follow the power market relevant to the named facility or supplier rather than attaching a national or PJM headline to a global platform.
- Label each item as an actual bill, contracted rate, capacity-auction result, load forecast, or projection. These are different kinds of evidence.
- Wait for a second link—such as a hosting-rate revision, cloud-price change, or vendor notice—before describing electricity pressure as commercial pass-through.
- Preserve forecast challenges and market-specific qualifications alongside the headline price.
Platform fees and margin signals
Platform earnings and capex guidance belong on a watchlist, not in a campaign attribution model. The Nvidia earnings and AI ad-tech benchmark watchlist can flag changes in hyperscaler investment, while the analysis of the Alphabet AI capex and marketing-tool trade-off helps distinguish investment from possible product or pricing consequences.
- Save dated fee schedules, contract terms, product-pricing announcements, and explicit statements about cost recovery.
- Treat earnings commentary about monetization, efficiency, or returns as a hypothesis until it names the advertising product and pricing mechanism.
- Replace superseded spending estimates with current guidance in the monitoring record, while retaining original publication dates for the historical entries.
- Do not infer an energy surcharge from a simultaneous increase in capex and CPM; timing alone does not identify the route.
Auction mechanics
- Annotate campaign change history with bid-strategy migrations, target changes, broad-match adoption, network expansion, creative changes, and platform product launches.
- Segment CPC and CPM movement by campaign type, query or audience mix, placement, device, geography, and time period before invoking a macro cause.
- Review impression share, top-of-page rates, auction competition, traffic volume, conversion rate, and cost per acquisition together. A higher CPC with broader or more valuable coverage has a different explanation from a higher CPC for unchanged traffic.
- Use controlled bid or targeting tests where possible, and state when platform reporting prevents isolation.
The broader macro-to-auction channel map helps place investment pressure in sequence. The method is similar to tracing what a CPI report actually changes for ad budgets: a macro indicator matters only through a defined transmission mechanism and a relevant account signal.
For now, buyers can monitor infrastructure cost per bid, applicable electricity-market pressure, platform fee or margin disclosures, and auction-level changes as four plausible paths. They can challenge claims that jump from data center spending directly to campaign inflation. What they cannot do with disclosed platform evidence is assign a campaign’s CPC or CPM increase to AI energy costs.
References
- Key Questions on Energy and AI, International Energy Agency, 2026.
- 10-figure bills for data centers ultimately leave advertisers on the hook, The Current, September 2025; updated June 2026.
- Adtech Cost Per Bid: 5 Questions Boards Will Ask, Servers.com, July 2026.
- Projected data center growth spurs PJM capacity prices by factor of 10, Institute for Energy Economics and Financial Analysis, July 2025.
- Ad Tech Economic Uncertainty, Energy Costs, and More, IAB, April 2025.
- Paying more for the same results, MRS Digital, April 2026.