
What NVIDIA Q2 earnings actually prove about AI ad costs
NVIDIA's Q2 FY27 earnings window is anchored by record infrastructure revenue, but headline inference-cost figures are vendor-published benchmarks — not proof that Performance Max, Advantage+, or AI Max campaigns got cheaper. Use this dated baseline to separate what NVIDIA actually reported from what you still need to verify in your own account.
- Platform
- Google Ads0 Meta Ads
- Campaign type
- Performance Max, Advantage+0 AI Max
- Spend range
- Account-specific
- Timeframe
- As of 0-08-27
- CPA, ROAS, CPM
- Q0 FY27 actuals pending
- Verdict
- mixed
- Last reviewed
- 0-08-27
Status: Q2 FY27 actuals pending
| Item | Status as of August 27, 2026 |
|---|---|
| Q2 FY27 actual results | Pending verification in the available research index; no Q2 actual revenue or earnings figure is used below. |
| Last confirmed results | Q1 FY27 results published May 20, 2026.[1] |
| Usable Q2 baseline | NVIDIA guided to $91.0 billion in revenue, plus or minus 2%, while assuming no Data Center compute revenue from China.[1] |
| Last reviewed | August 27, 2026 |
The actual Q2 print will be added after it can be verified against a primary release. Until then, the confirmed-versus-pending earnings tracker and the companion record for AI ad buyers remain the earnings-record homes. This article uses the latest confirmed baseline rather than treating an unavailable Q2 number as fact.
The claim-check that matters for ad buyers
| Claim type | What the available evidence says | What it can establish |
|---|---|---|
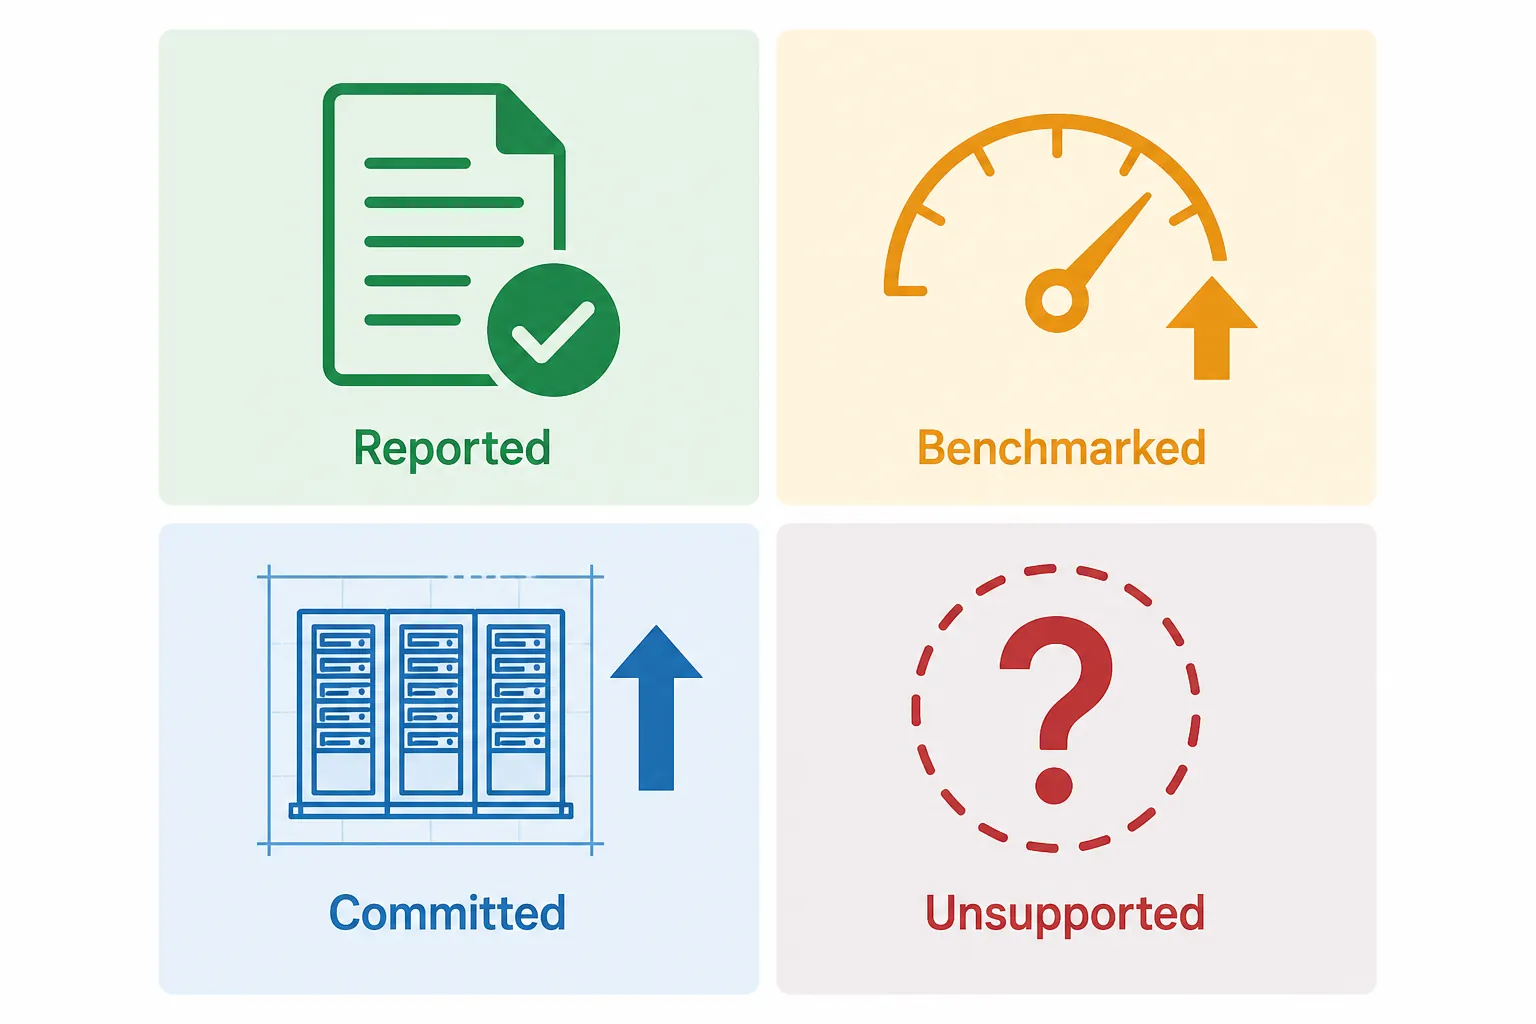
| Reported financial result | Q1 FY27 revenue was $81.6 billion, up 85% year over year. Data Center revenue was $75.2 billion, up 92% and equal to about 92% of total revenue. Compute revenue was $60.4 billion, networking revenue was $14.8 billion, and non-GAAP diluted EPS was $1.87.[1] | NVIDIA’s infrastructure business was expanding rapidly at the last confirmed reporting date. |
| Management guidance | Q2 FY27 revenue guidance was $91.0 billion, plus or minus 2%, with no China Data Center compute revenue assumed.[1] | Management’s expectation for the quarter, not the quarter’s actual result. |
| Vendor-published benchmark | A February 2026 NVIDIA blog post presenting SemiAnalysis InferenceX data claimed up to 10x lower cost per token on Blackwell and a 35x GB300 NVL72-versus-Hopper result.[2] | Performance under the benchmark’s stated workload and configuration. It is not an advertiser’s cost or campaign result. |
| Infrastructure commitment | Meta committed to deploying millions of Blackwell and Rubin GPUs, while AWS announced a commitment for 2 million additional GPUs during 2027 and 2028.[3][4] | Strong directional evidence of planned demand and capacity expansion, not proof that the capacity has already reduced ad prices. |
| Unsupported conclusion | Performance Max, Advantage+, AI Max, or Symphony became cheaper or more effective because NVIDIA’s inference economics improved. | Nothing in the available source set establishes this conclusion. |
The financial trajectory deserves attention. Record Data Center revenue and large GPU commitments mean that more AI capacity is being financed, purchased, and prepared for deployment. That is substantially stronger evidence than a vague claim that “AI is growing.” It still answers a supply-side question, while a media buyer is responsible for an account-level outcome.
The distinction becomes especially important with cost-per-token figures. A token benchmark measures the economics of running a specified model or workload on specified infrastructure. CPA measures spend relative to attributed conversions. Between those metrics sit the platform’s model architecture, workload mix, utilization, product decisions, auction mechanics, margins, measurement system, and the advertiser’s own inputs.
Where NVIDIA’s numbers connect to advertising—and where they stop
NVIDIA’s new reporting framework defines its Data Center Hyperscale submarket as public clouds plus the world’s largest consumer internet companies.[1] That definition supplies a legitimate structural bridge to advertising: the same broad class of companies buying AI infrastructure includes businesses operating major consumer platforms.
The commitments show the scale. NVIDIA said in February 2026 that Meta planned to deploy millions of Blackwell and Rubin GPUs across its AI infrastructure.[3] On August 26, NVIDIA and AWS announced that AWS would deploy 2 million additional NVIDIA GPUs during 2027 and 2028.[4] These are vendor and partner announcements rather than measurements of realized advertiser benefits, but they are meaningful evidence that infrastructure demand is not merely hypothetical.

From there, the transmission path becomes indirect, lagged, and vulnerable to offsets:
- GPU supply and system efficiency affect the cost and availability of computing capacity.
- A cloud provider or consumer platform must deploy that capacity, reach useful utilization, and decide which workloads receive it.
- The ad platform may spend the efficiency gain on more model calls, larger models, faster experimentation, creative generation, ranking, measurement, safety systems, or other products rather than reducing its total operating cost.
- Even if platform operating costs decline, the platform decides whether to retain the saving, reinvest it, change product access, or allow any benefit to reach the auction.
- Campaign outcomes then depend on competition, inventory, targeting constraints, creative quality, conversion rates, attribution, budget, and bid settings.
This path is analysis from the infrastructure evidence, not a sourced finding that a particular ad product uses fewer dollars per impression. The available materials contain no per-impression inference costs, no allocation of infrastructure savings to advertisers, and no documented NVIDIA connection to Symphony. They also do not provide AI-specific ad-spend figures that could close the gap.
The February benchmark illustrates the scope problem. NVIDIA published the Blackwell and GB300 NVL72 results using SemiAnalysis InferenceX data and promoted them as major improvements in inference economics.[2] “Up to” results are conditional on the tested configuration and workload. They do not reveal the blended cost of all inference performed by an ad platform, how much inference is used for one ad opportunity, or whether lower unit costs lead the platform to consume more compute.
That last possibility matters. Efficiency can lower the cost of a fixed workload while total spending rises because the company runs more workloads. A platform might use cheaper tokens to consider more candidate ads, generate more assets, add model stages, or expand automation. Those choices could eventually improve a campaign, but the benchmark itself observes none of them.
For a deeper separation of these links, the AI infrastructure-to-ad-pricing transmission chain tracks the indirect and partially offset route. The related analysis of why capex is more useful than NVIDIA stock movement covers the financial signal without turning share-price movement into an ad-performance forecast.
Build an account-level verification window
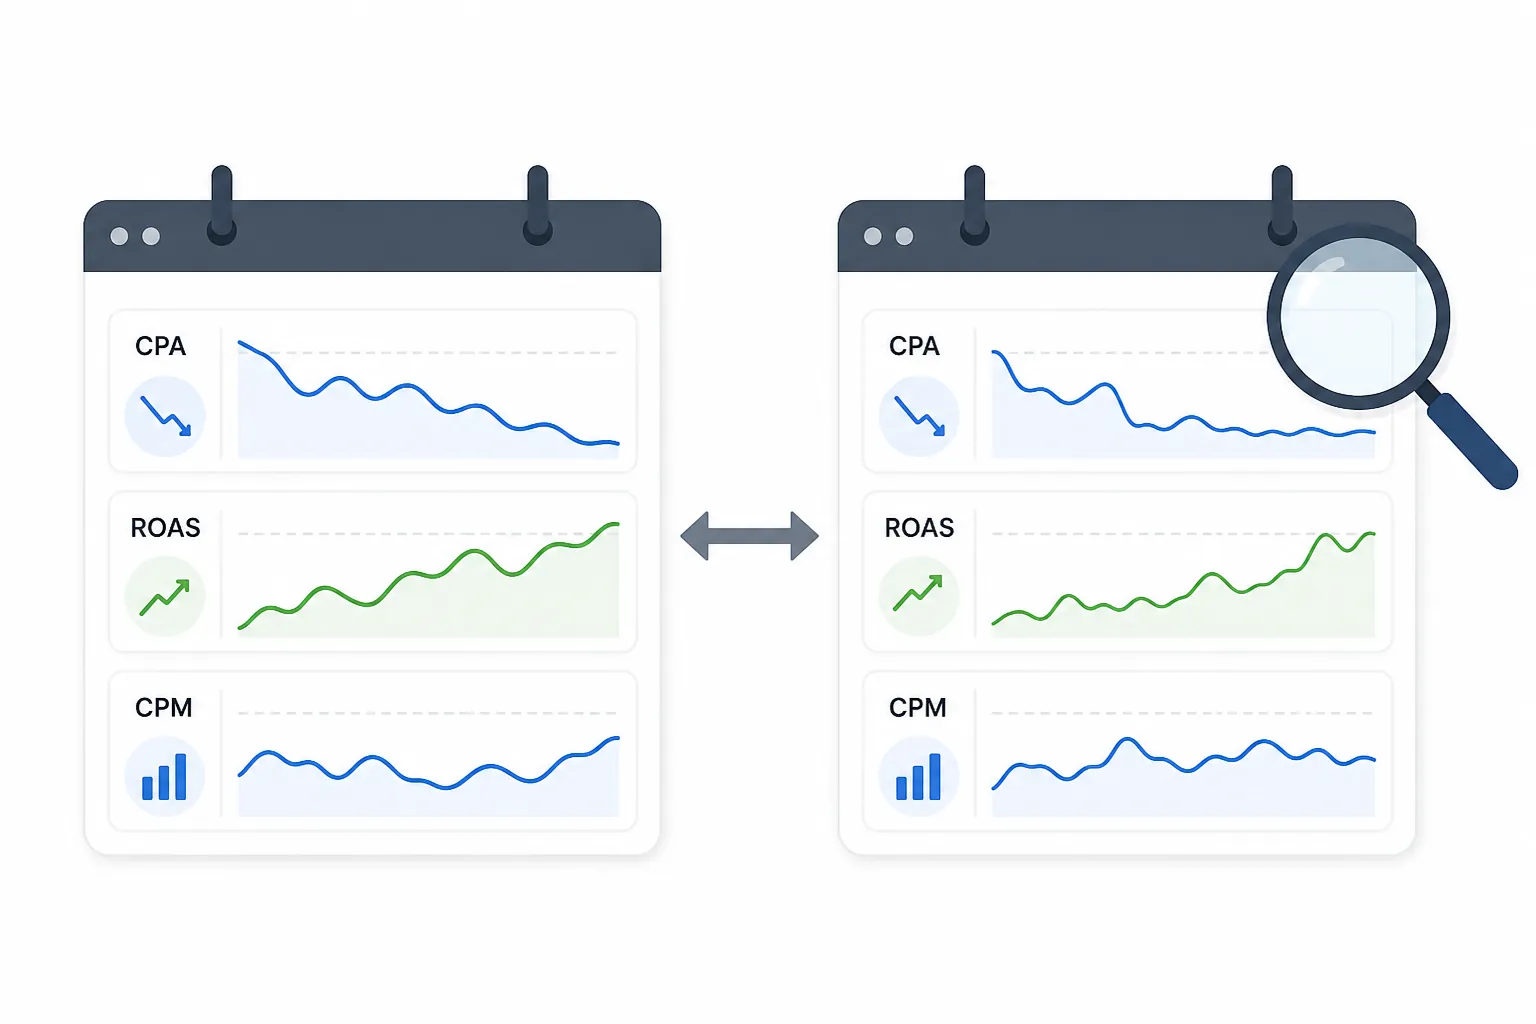
A buyer cannot verify NVIDIA’s benchmark from a Google Ads or Meta Ads account. The useful test is narrower: determine whether CPA, ROAS, and CPM moved during a dated period in which the account’s automation or platform environment changed.
Record the intervention before choosing the comparison
Start with the date of the observable change. It might be an account migration, a newly enabled automated setting, a bidding change, broader asset eligibility, or a platform-documented rollout that reached the account. Save the settings snapshot and note whether the change was made by the buyer, imposed as a new default, or introduced by the platform.
If there is no defensible change date, there is no clean before-and-after test. The account can still be monitored, but movement should not be assigned to a vaguely timed AI improvement.
Compare periods that are genuinely comparable
- Use windows of equal length and align weekdays where daily behavior differs.
- Keep the conversion definition and attribution settings consistent.
- Separate major budget, bid-target, geography, audience, feed, landing-page, and creative changes.
- Annotate promotions, holidays, inventory shocks, tracking failures, consent changes, and unusual sales conditions.
- Compare within the same platform and campaign scope before attempting a blended cross-platform conclusion.
Known defaults belong in the record because a nominally unchanged campaign can behave differently after an automated option, eligibility rule, or reporting definition changes. Screenshots or exported settings are more useful here than relying on memory after performance has moved.
Read CPA, ROAS, and CPM together
| Metric | What it observes | What must be checked before crediting automation |
|---|---|---|
| CPA | Spend relative to attributed conversions | Conversion volume, conversion definition, attribution, lead or sale quality, and reporting lag |
| ROAS | Attributed revenue relative to spend | Revenue tracking, order values, discounting, returns, attribution, and customer mix |
| CPM | Spend per thousand impressions | Inventory mix, geography, audience, placement, seasonality, competition, and delivery changes |
A lower CPM with a worse CPA can mean the system found cheaper impressions that converted less effectively. A lower CPA with a stable CPM points toward a change elsewhere, such as conversion rate, audience mix, creative response, or measurement. Higher ROAS during a promotion may be commercially welcome without establishing that the platform’s AI improved.
Before opening the results, define the finance-approved success condition: which metric must improve, what guardrails apply to volume and quality, and which costs or revenues the account record includes. Otherwise, a platform can appear to “win” through whichever metric happened to move favorably.
A simple period comparison still does not prove causation. It does, however, produce the evidence needed for the actual planning decision: whether this account improved after a documented change, under conditions close enough to support continued spend or further testing. The feature-cadence benchmark companion can help keep product-rollout observations separate from NVIDIA’s reporting calendar.
The defensible Q2 earnings verdict
The latest verified NVIDIA results establish rapid AI infrastructure growth, and the announced Meta and AWS commitments reinforce that direction. NVIDIA’s published benchmarks also claim steep improvements in inference efficiency. Neither evidence class proves that Performance Max, Advantage+, AI Max, or Symphony became cheaper or better for advertisers.
The Q2 FY27 actuals may strengthen or weaken the supply-side trajectory once verified, but they will not remove the transmission problem by themselves. This baseline will be updated with the primary Q2 release and its publication date when those results are verifiable. Until then, the buyer’s dated CPA, ROAS, and CPM record is the only available evidence here that can show whether automation improved in the account responsible for the spend.
References
- NVIDIA Announces Financial Results for First Quarter Fiscal 2027. NVIDIA Newsroom, May 20, 2026.
- Data: Blackwell Ultra Performance, Lower Cost for Agentic AI. NVIDIA Blog, February 2026.
- Meta Builds AI Infrastructure With NVIDIA. NVIDIA Newsroom, February 17, 2026.
- AWS and NVIDIA to Deliver 2 Million Additional GPUs and Next-Generation Infrastructure for Agentic and Physical AI. NVIDIA Newsroom, August 26, 2026.
Built on this evidence
No Bidding tactic or Creative record currently cites this case file. Compare it against other results in Benchmarks.
Related benchmark reading
Report a corroborating or contradicting result
Seeing something different in your own account? Feed the data-integrity loop instead of leaving an open comment.