
Are Trump tariffs and AI chip shortages raising ad costs?
A dated evidence map of the tariff-to-ad-cost chain, separating the documented cost shock — memory-chip and AI-server price increases, the data-center buildout — from the still-unproven claim that tariffs are raising auction-level CPMs and CPCs. Media buyers and growth leads get source-dated evidence for briefing CFO/CRO stakeholders, plus a clear read on which 2026–2027 dashboard impact is real versus forecast.
- Platform
- Cross-platform
- Change category
- policy
- Change type
- policy shift
- Impact level
- Moderate
Evidence register — last reviewed August 28, 2026. The upstream cost shock is real: memory prices, AI-server prices, and semiconductor-heavy data-center construction are all under pressure. Some auction inflation has also been documented in this site’s memory and semiconductor records. What the available evidence does not establish is that Trump tariffs caused higher CPMs or CPCs. That final attribution remains unverified.
| Link in the pipeline | Status on August 28, 2026 | What the evidence supports | What remains unproven |
|---|---|---|---|
| Tariff policy → importer costs | Documented | Semiconductor-related duties and broader import charges have changed repeatedly; consumer-technology importers reported a substantial increase in tariffs paid. | The amount attributable to advertising platforms or ad delivery. |
| Tariffs → chip and server prices | Partly documented | Some semiconductor imports are exposed, although exemptions and data-center carveouts narrow the effect. Scenario models show potentially large buildout costs under much broader tariffs. | How much of an observed memory-chip or AI-server increase came from tariffs rather than demand, scarcity, or product mix. |
| AI demand and memory scarcity → hardware prices | Documented or forecast by named sources | Separate reports point to higher DRAM prices and higher Nvidia server prices during 2026. | A single blended inflation rate for all chips, servers, or data centers. |
| Hardware prices → platform infrastructure costs | Plausible synthesis | Semiconductors are a large component of data-center infrastructure, so sustained hardware inflation can increase replacement and expansion costs. | Platform-level unit costs, allocation decisions, and timing. |
| Infrastructure costs → CPM/CPC | Mixed | This site has recorded higher Meta ad prices and CPM movement alongside memory and semiconductor pressure. | A sourced estimate isolating tariffs as the cause of that auction movement. |
| Tariffs → advertiser dashboard | Unverified synthesis | Possible routes include platform cost recovery, advertiser budget cuts, product-price inflation, and demand changes. | Direct, tariff-attributable movement in CPM, CPC, conversion rate, or auction density. |
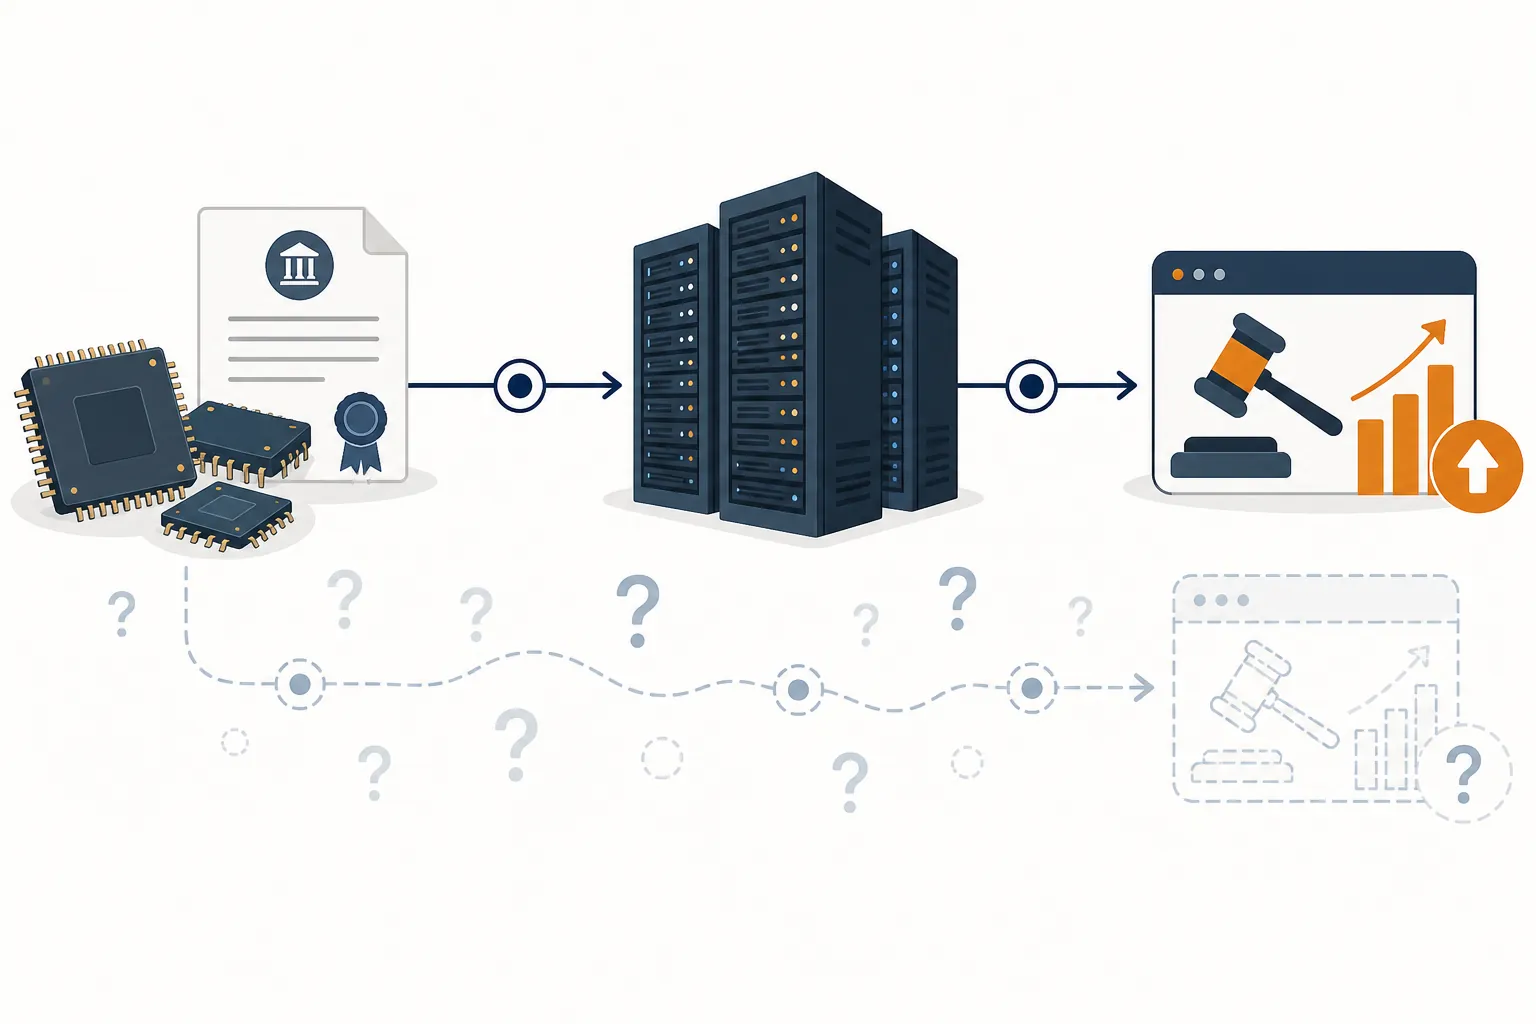
For a growth lead preparing a 2027 forecast, that distinction matters more than the headline. A hardware-cost increase can be dated and observed without proving the route by which it reaches an ad account. Likewise, a tariff can be real and expensive at the border without producing a higher clearing price in an auction. The useful analysis begins by keeping those records separate.
Two cost shocks are being compressed into one story
The first driver is trade policy. It changes what importers pay, which products are exposed, and whether a planned data-center purchase qualifies for an exemption. The second is the AI investment cycle: hyperscalers and model developers are competing for memory, accelerators, servers, networking equipment, and manufacturing capacity. The two can reinforce each other, but they are not interchangeable explanations.
On the memory side, Gartner forecast that DRAM prices would rise 47% in 2026, as reported by Network World on January 7, 2026.[1] Counterpoint produced a different and narrower estimate: an 80%–90% increase during the first quarter of 2026, reported by IEEE Spectrum on February 10.[2] These figures have different scopes and time windows. They should not be averaged into a synthetic “chip inflation” number.
Server evidence points in the same direction without resolving attribution. Network World reported on August 24 that Nvidia server prices had risen by roughly 30% in July 2026, with approximately another 15% attached to early-2027 deliveries.[3] That is a dated server-price observation, not proof that tariffs produced either increase.
The demand mechanism is straightforward. AI servers use high-value accelerators and memory, while expanding data centers require power, cooling, networking, and supporting compute. CSIS estimated that semiconductors account for about 54 cents of every dollar of data-center infrastructure investment.[4] When scarce memory and advanced compute become more expensive, they therefore affect a meaningful share of the buildout rather than a peripheral component.
CSIS also modeled a 100% tariff scenario and reported a 53.3% increase in buildout cost.[4] It is a scenario, not an invoice already paid by hyperscalers. It should be briefed as an estimate of exposure under a specified policy assumption, not as an observed increase in 2026 infrastructure spending.
The tariff timeline changes the exposure
A generic “Trump tariff” variable is not sufficient for a media-cost forecast. Product coverage, legal authority, effective dates, exemptions, and reversals determine whether the hardware in question is actually exposed.
| Date | Policy event | Relevance to the cost pipeline |
|---|---|---|
| January 1, 2025 | The Section 301 rate on specified Chinese semiconductor imports reached 50%. | A real tariff increase, but limited by product origin and coverage. |
| April 2025 | Reciprocal tariffs were announced with semiconductor exemptions. | The exemption interrupted any simple route from the broad tariff announcement to chip costs. |
| August 1, 2025 | A 50% tariff on covered copper imports took effect. | Potentially relevant to electrical and data-center construction inputs; it does not establish semiconductor or auction inflation. |
| January 15, 2026 | A Section 232 tariff of 25% applied to a narrow group of advanced AI chips, with data-center-related carveouts. | The carveouts reduced exposure for qualifying uses and buyers. |
| February 20, 2026 | The Supreme Court struck down the use of IEEPA for the challenged tariffs; refunds proceeded while a Section 122 surcharge supplied a separate 10% charge. | Legal authority and refund treatment changed the effective burden. |
| July 24, 2026 | A forced-labor Section 301 action imposed rates of 10%–12.5% on covered goods. | Adds product-specific exposure without creating a universal semiconductor rate. |
| August 27, 2026 | A broader semiconductor action remained under consideration, with reports that some carveouts might be removed. | A pending policy risk as of the review date, not a completed cost event. |
This chronology explains why a quarterly model built from the announced headline rate can fail. A 50% rate on a covered Chinese semiconductor, a 25% rate with a data-center carveout, and a proposed broader action are three different exposures. One is not a proxy for the others.
The broader tariff burden is nevertheless material. The Yale Budget Lab estimated that the U.S. effective tariff rate was 11.0% in early 2026, the highest since 1943; it estimated an 8.2% rate if the Section 122 surcharge expired.[7] The Consumer Technology Association reported that consumer-technology importers paid $23.5 billion in tariffs in 2025, up from $4.0 billion in 2024, while the average rate rose from roughly 1% to roughly 7%.[8]
Those figures establish border and importer exposure. They do not identify which companies absorbed the charge, negotiated supplier concessions, changed sourcing, delayed purchases, raised customer prices, or reduced margins. None measures an ad auction.
Where infrastructure pressure can meet an auction
The platform-cost route is possible, but it contains several management decisions between the server invoice and the advertiser’s CPM. A platform can absorb higher compute costs, improve utilization, change model architecture, extend hardware life, prioritize capital spending, alter product margins, or recover costs elsewhere. Even when it changes auction mechanics or monetization, advertiser demand still helps determine the clearing price.
There is account-level evidence that the non-tariff side deserves attention. Signal & Convert’s record of AI inference-chip demand and ad costs logged Meta’s reported 14% increase in average ad price during the first quarter of 2026 and benchmark CPM movement from approximately $11.82 to $14.19. That establishes price direction in the documented account record. It does not separate memory costs from advertiser demand, placement mix, targeting, seasonality, product changes, or tariffs.
Other entries strengthen the infrastructure signal without solving that attribution problem. The HBM4 and CPM benchmark treats an approximately $500 HBM4 stack as a leading hardware indicator. The Qualcomm memory-shortage record follows a price increase effective September 1, 2026, through the possible route from fabrication to platform infrastructure. The related Qualcomm AI-chip earnings analysis supplies company-level context rather than a universal chip-price index.
The Advantest profit-revision record tracks hyperscaler capital expenditure as an upstream indicator, while the Apple AI supply-chain tracker preserves dated events before making downstream inferences. Read together, these records support monitoring memory scarcity and AI-infrastructure spending. They do not provide a tariff coefficient for CPM or CPC.
What could appear in a 2026–2027 dashboard
A tariff-related business shock can reach paid media through more than one route, and several routes would push auction prices in opposite directions. That is why “chips cost more, therefore CPM rises” is not a usable forecast model.
- Platform-cost route: infrastructure becomes more expensive, and a platform changes monetization, delivery, or investment priorities. The observable account result might include higher CPM, higher CPC, altered reach, slower product improvements, or no immediate change.
- Advertiser-margin route: importers and hardware-dependent businesses face higher costs and reduce paid-media budgets. Lower auction demand could soften prices even while the advertiser’s own economics deteriorate.
- Consumer-price route: brands pass costs to customers. Conversion rate may weaken before CPM or CPC moves, leaving acquisition cost higher because fewer clicks convert.
- Category-reallocation route: exposed advertisers cut spending while less-exposed categories increase it. An aggregate platform number can remain strong while individual accounts diverge sharply.
- AI-capacity route: improved recommendation, creative, or targeting systems increase monetization or advertiser demand. Auction prices could rise alongside better conversion performance, making the net acquisition-cost effect account-specific.
The first dashboard check should therefore be decomposition, not attribution. Separate CPM from CPC, click-through rate, conversion rate, average order value, and impression volume. A higher customer-acquisition cost caused by weaker conversion is operationally different from an auction-price increase. Calling both “tariff inflation” conceals the step that actually changed.
| Observed dashboard pattern | What it may indicate | What would be needed before citing tariffs |
|---|---|---|
| CPM rises while auction participation or impression demand also rises | Demand pressure, seasonality, mix changes, or platform monetization | A dated policy event, exposure by platform or market, and evidence excluding stronger alternative explanations |
| CPC rises while CPM is stable | Lower click-through rate or creative deterioration | Evidence that tariff exposure changed click behavior rather than merely coinciding with it |
| Acquisition cost rises while CPM and CPC are stable | Conversion-rate, pricing, inventory, or landing-page pressure | A demonstrated tariff effect on the advertiser’s offer or customer demand |
| Spend and impression demand fall in exposed categories | Budget contraction or margin protection | Category-level exposure and a timeline matching purchasing or budgeting decisions |
| CPM rises across exposed and unexposed categories | A broad auction, seasonal, or platform effect | Cross-market evidence showing a stronger change where tariff exposure is greater |
This is also where lag assumptions need discipline. A tariff effective on one date does not necessarily change a platform’s cost base that day. Existing inventory, long-term supply contracts, carveouts, refunds, and capital-purchase schedules can delay or eliminate the exposure. An auction move in the same week is temporal proximity, not proof of pass-through.
Ad demand is the counterweight
Infrastructure inflation is only one side of an ad auction. IAB forecast U.S. advertising spending to grow 9.5% in 2026.[9] That forecast indicates expected demand growth; it does not establish that the growth will occur uniformly, that it was caused by AI, or that tariffs will lift auction prices.
The historical tariff-era evidence points to another possible outcome. ClickZ’s April 2025 account of the 2018–2020 cycle reported advertising-budget reductions of 7% in automotive and 5% in retail.[10] Those are dated category findings from an earlier cycle, not a forecast for 2026. Their value is directional: when trade costs compress advertiser margins, some companies cut demand rather than bid more.
The two forces can coexist. Platforms may be paying more for infrastructure while tariff-exposed advertisers are pulling back. Other advertisers may increase spending, and AI-enabled products may improve monetization. The resulting CPM is the auction’s net outcome, not a direct readout of a server bill.
The finance briefing that the evidence can support
For a CFO or CRO review, the clean briefing has three lines. Memory and AI-infrastructure pressure is observable and supported by dated chip, server, construction, and auction records. Tariff exposure is also real, financially material, and still changing as product coverage and carveouts move. Tariff-driven CPM or CPC inflation has not yet been isolated in the sourced evidence.
That supports a monitored forecast risk, not an automatic CPM uplift. A planning model can carry separate sensitivities for auction inflation, conversion pressure, and category-level budget contraction, but the tariff rate should not be pasted directly into the media-cost assumption. It measures a different stage of the pipeline.
The record should be refreshed when either of two things happens: a new semiconductor policy becomes effective with defined coverage and carveouts, or attributable auction evidence appears that compares CPM or CPC movement by tariff exposure while addressing demand, seasonality, placement, and mix. Until then, the defensible label for tariff-driven auction inflation is unverified.
References
- Gartner DRAM price forecast coverage — Network World, January 7, 2026
- Counterpoint Q1 2026 memory-price forecast coverage — IEEE Spectrum, February 10, 2026
- Nvidia server price-increase coverage — Network World, August 24, 2026
- Data-center semiconductor intensity and 100% tariff scenario — Center for Strategic and International Studies, May 14, 2026
- Section 232 AI-chip tariff and data-center carveouts — Thompson Hine SmarTrade, January 2026
- Broader semiconductor tariff action under consideration — Politico, August 27, 2026
- U.S. effective tariff-rate estimate — Yale Budget Lab, April 2, 2026
- Consumer-technology importer tariff totals — Consumer Technology Association, May 2026
- 2026 U.S. advertising-spend forecast — Interactive Advertising Bureau, January 28, 2026
- Tariff-era automotive and retail advertising-budget reductions — ClickZ, April 2025
Primary source: https://www.csis.org