
Amazon Q2 Earnings Signal Q3 Ad Cost Pressures for Advertisers
Amazon's Q2 2026 earnings reveal a $19.8B ad business funding $220B in AI capex, with three concrete signals for advertisers to track in Q3: CPC inflation, Ads Agent claim discrepancies, and a Prime Day timing shift that depresses comps. This Tracker entry helps performance marketers plan Q3-Q4 budgets without reacting to stock noise.
- Platform
- Amazon Ads
- Change category
- bidding
- Effective date
- 0-07-30
- Change type
- opt-in feature
- Impact level
- Medium
Jul 30, 2026 — Amazon’s latest completed-quarter record is Q2 2026, not Q3. As of Jul. 31, 2026, “Amazon Q3 earnings” is a forward-looking advertiser watch: the usable material is Amazon’s Q2 release, its Q3 revenue guidance, and the ad-product signals buyers can monitor before Q3 actuals arrive. Amazon reported Q2 on Jul. 30, 2026, and CNBC’s same-day coverage cross-checked the headline numbers; the prior-year Q3 report landed on Oct. 30, so late October 2026 is the practical update window for Q3 actuals.[1][2][3]
| Tracker field | Q2 2026 / Q3 watch record |
|---|---|
| Latest reported quarter | Q2 2026. Q3 2026 actuals are not yet reported; this entry tracks Q3 guidance and advertiser signals.[1][3] |
| Total revenue | $200.6B in Q2 2026.[1][2] |
| AWS | $42.2B, up 37%, described by CNBC as the fastest growth in 18 quarters.[1][2] |
| Advertising | $19.809B, up 26% year over year excluding foreign exchange; roughly 9.9% of total revenue based on reported Q2 revenue.[1] |
| Capital expenditures | FY2026 capex guidance raised to $220B; Q2 capex was $54.2B versus $32.1B a year earlier.[1][2] |
| Free cash flow | Trailing-12-month free cash flow swung to -$7.6B from +$18.2B a year earlier.[1][2] |
| Q3 2026 guidance | $197B–$202B in revenue, up 9%–12%; Amazon said growth would be roughly 400 basis points higher excluding the Prime Day timing shift.[1] |

The stock reaction and the AWS-capex debate are secondary for media buyers. The first question is whether Amazon’s need to fund AI infrastructure and keep revenue growth visible will show up as denser auctions, more ad surfaces, or stronger sales pressure behind managed and automated products.
The advertiser-facing changes are already in market
Amazon placed three campaign-surface signals inside the Q2 release: Ads Agent expansion to 11 new countries, Rufus brand prompts, and continuing Prime Video ad inventory growth. Those matter more to a Q3 budget owner than the day-one stock move because they affect where spend can be placed, how much manual work Amazon wants to remove, and which auction surfaces may get more demand next.
Ads Agent is the most immediate planning issue. In the Q2 release, Amazon said advertisers using Ads Agent saw “8% lower CPM and 6% lower CPA.” On the Ads Agent product page, the claim is larger: CPM down 18% and CPA dropped 16%, attributed to “Amazon Internal, US, 2025” beta data.[1][4] Those are not interchangeable planning assumptions. One looks like a modest efficiency adjustment; the other can change whether a buyer moves budget from manual campaign management into Amazon’s agentic workflow.
The gap does not prove the tool underperforms. It does mean the claim needs a methodology line before it belongs in a forecast: which advertisers, which campaign types, what baseline, what time period, and whether the release figure and the product-page figure refer to different populations. Until Amazon clarifies that, buyers should treat the claim as a test hypothesis and compare it against their own spend, incrementality, and placement mix. For a spend-grounded way to evaluate Amazon Ads claims against real campaign records, keep the Ads Agent test beside an existing Amazon Ads benchmark record, not beside a product-page percentage.
Rufus brand prompts are less about this week’s CPC and more about future retail discovery. If Amazon trains shoppers to ask a retail AI surface for comparisons, gift ideas, or product guidance, the value of being eligible inside those prompts rises. That is a different buying problem from keyword harvesting: the brand has to know what the model can see, which assets it uses, and whether sponsored visibility starts to blend with recommendation behavior. The mechanism belongs in the same family as the broader AI attention stack in advertising, where the surface that answers the shopper can become the surface that allocates attention.
Prime Video is the cleanest new supply story, but the audience number needs its date attached. Amazon Ads said Prime Video had 315 million monthly ad-supported viewers based on Amazon Internal data covering Sept. 2024 through Aug. 2025, and it listed 2026 country additions including Belgium, Denmark, Norway, and Turkey.[5] That is useful reach context, not a current Q3 2026 census. Buyers moving budget into streaming should still map the inventory against their own frequency, completion-rate, and retail-attribution targets; the broader streaming comparison belongs in a streaming services comparison for marketers, not only in Amazon’s reach deck.

Why ad growth is the pressure point inside the AI capex story
Amazon’s advertising business is now large enough that it cannot be treated as an add-on to retail media. In Q2 alone it generated $19.809B. Earlier in 2026, Andy Jassy said Amazon’s trailing-12-month advertising revenue had passed $70B.[1][6] That scale changes the buyer’s read on AI capex: if the company is committing $220B of FY2026 capital expenditure while free cash flow is negative on a trailing-12-month basis, the ad business becomes one of the clearest places to protect growth without waiting for every AI infrastructure investment to mature.[1][2]
The one-year comparison shows the escalation. In Q3 2025, CNBC reported Amazon had guided to $125B in capex, while ads revenue was $17.7B and AWS grew 20.2%.[3] The current report puts FY2026 capex guidance at $220B, Q2 AWS growth at 37%, and Q2 ads at nearly $20B.[1][2] For an investor, that is a question about how much future AI demand justifies near-term spending. For an advertiser, it is a question about whether Amazon’s platform efficiency becomes lower clearing prices, more auction density, more monetized surfaces, or some mix of all three.
Market framing is split for a reason. Coverage after the release emphasized the tension between stronger AWS growth and the drag from higher AI capex; Investing.com also highlighted that AWS margin recovered to 39.4% while investors weighed that against spending pressure.[7] That range matters, but it should not be converted into an advertiser benefit. Neither a healthier AWS margin nor a larger AI budget automatically lowers Sponsored Products CPCs or makes Ads Agent cheaper for the buyer.
The infrastructure angle is still worth watching. AWS has been publishing material on agentic bidding using ARTF containers with NVIDIA GPU acceleration, which points to the kind of low-latency infrastructure required when bidding systems become more automated.[8] The relevant planning question is not whether Amazon can make auctions faster. It is whether faster decisioning increases bid competition faster than it improves campaign efficiency. That is the same containment problem raised in agentic ad-buying systems, and it overlaps with the infrastructure tradeoffs in ad-tech inference capacity and the auction-speed effects tracked in AI acceleration of auctions.
Q3 guidance has a Prime Day distortion buyers should normalize
Amazon guided Q3 revenue to $197B–$202B, implying 9%–12% year-over-year growth. It also said growth would be about 400 basis points higher excluding the Prime Day timing shift.[1] The practical issue is calendar placement: Prime Day fell in June 2026 rather than July 2025. That pulls a demand event into Q2 this year and out of Q3’s reported comparison.
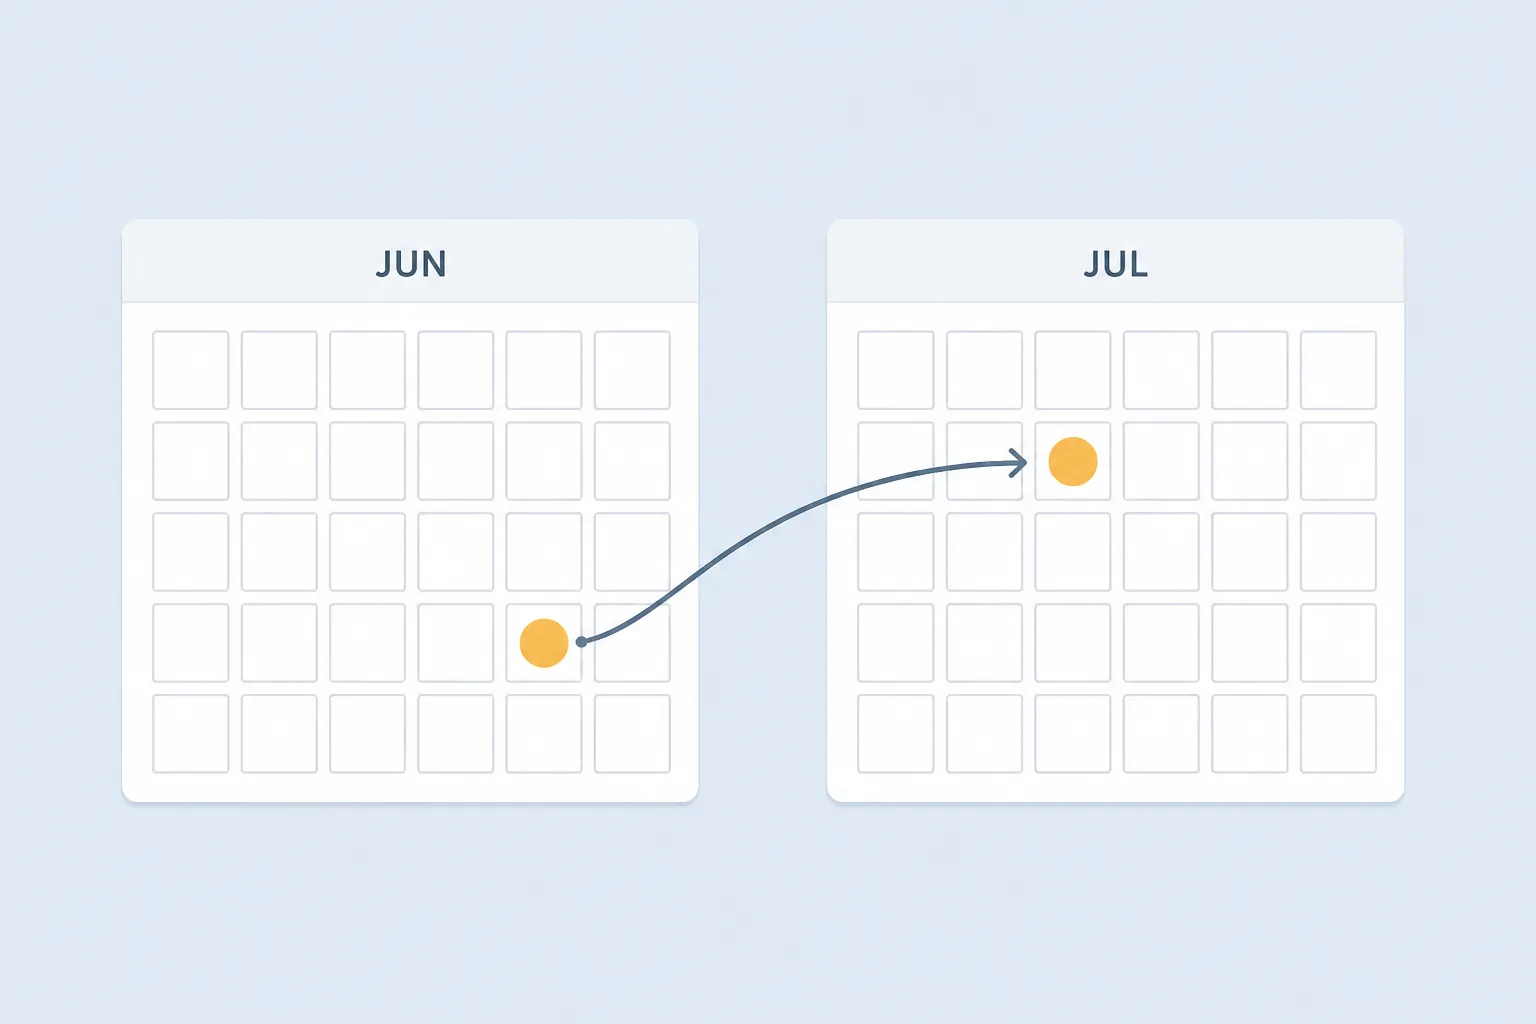
For retail media pacing, that means a weak-looking Q3 comp may not indicate weak demand. It may indicate that a high-intent shopping event moved into the previous quarter. The reverse is also true for Q2: stronger ad demand around June does not necessarily mean the underlying auction has structurally improved. Buyers should separate event windows from baseline weeks before changing Q4 bids.
A clean read compares like with like: Prime Day event days against prior Prime Day event days, post-event cooldown against post-event cooldown, and non-event Q3 weeks against non-event Q3 weeks. If July looks softer because the event moved, that is not a reason by itself to cut Q4. If non-event August and September CPCs stay elevated even after the timing adjustment, that is a more important warning.
Three Q3 signals to track before touching Q4 budgets
| Signal | What to verify | Budget consequence |
|---|---|---|
| Ads Agent claim gap | Whether your campaigns see anything closer to the Q2-release claim of 8% lower CPM and 6% lower CPA or the product-page claim of 18% lower CPM and 16% lower CPA.[1][4] | Do not bake either number into Q4 forecasts until there is account-level evidence and a clear test/control method. |
| CPC inflation | Whether third-party CPC context keeps moving higher after Prime Day normalization. Ad Badger reports an average Amazon CPC of $1.22 in 2026, up about $0.10 year over year, with May 2026 at $1.27.[9] | If non-event CPCs stay elevated, preserve margin by tightening keyword tiers, placement multipliers, and category-level bid caps before scaling. |
| New surfaces: Rufus and Prime Video | Whether spend in AI-guided retail discovery or ad-supported streaming produces incremental reach or simply reallocates spend from Sponsored Products and DSP. | Shift budget only when the surface changes reach, conversion path, or incrementality; do not treat new inventory as automatically cheaper inventory. |
The CPC line needs the most caution. Ad Badger’s figures are useful because they come from active Amazon Ads tool users, but they are not a representative sample of every Amazon advertiser.[9] They are best used as a pressure gauge: if an account’s own Sponsored Products CPCs are rising in the same direction as that benchmark, the buyer has a reason to investigate auction density, match-type expansion, and placement premiums. If the account diverges, the account wins.
The Ads Agent test should be narrower than the sales pitch. Pick campaign families where the tool can actually change bids, budgets, targeting, or creative recommendations. Hold out comparable campaigns where spend, seasonality, and product economics are close enough to make the read useful. Measure CPM, CPC, CPA, conversion rate, TACOS or contribution margin, and wasted spend movement. A lower CPM that arrives with weaker conversion quality is not the same as lower acquisition cost.
Prime Video deserves a separate line in the pacing sheet because it can solve reach problems that Sponsored Products cannot. It should not be used as a pressure-release valve unless the buyer knows what pressure is being released. If Prime Video spend reduces dependence on expensive lower-funnel keywords and still drives measurable retail lift, the surface is doing real work. If it only moves dollars into a harder-to-audit pool, the lower-funnel auction still has to be fixed.
Update log to keep open through Q3
- Q3 2026 actuals: expected in the late-October reporting window, with Oct. 30 as the prior-year reference point.[3]
- Prime Day normalization: separate June event demand from Q3 baseline demand before reading Q3 ad growth or retail conversion weakness.
- Ads Agent verification: watch whether Amazon clarifies the 8%/6% release claim versus the 18%/16% product-page claim, including population, sample, and methodology.
- CPC pressure: track whether account-level CPCs keep rising after event timing is normalized, especially against third-party context showing $1.27 in May 2026.[9]
- Prime Video and Rufus: monitor whether new inventory and AI retail prompts create incremental reach and conversion paths or simply give Amazon more places to monetize the same advertiser demand.
References
- Amazon.com Announces Second Quarter Results — Amazon Investor Relations, July 30, 2026
- Amazon (AMZN) Q2 earnings report 2026 — CNBC, July 30, 2026
- Amazon (AMZN) Q3 earnings report 2025 — CNBC, Oct. 30, 2025
- Ads Agent — Amazon Ads
- Prime Video advertising 2026 — Amazon Ads Newsroom
- Andy Jassy Amazon Ads Q1 2026 earnings — About Amazon
- Amazon Slides as Investors Weigh AWS Growth Against AI Capex Drag — Investing.com
- Deploy agentic bidding without sacrificing speed: ARTF containers with NVIDIA GPU acceleration on AWS — AWS Blog
- Amazon Advertising Stats — Ad Badger
Primary source: https://ir.aboutamazon.com/news-release/news-release-details/amazoncom-announces-second-quarter-results