AI for Real Estate Marketing: The Adoption Data, ROI Benchmarks, and Agent Use Cases That Matter in 2026
A data-driven benchmark brief for marketing managers, brokerage ops leads, and senior agents. This article synthesizes sourced statistics from NAR, Zillow, Inside Real Estate, and MarketsandMarkets to show what AI adoption actually looks like in real estate marketing — and what the numbers say about content marketing ROI, lead conversion, and visual marketing impact.

Why 2026 Is the Year AI in Real Estate Marketing Moved From Experiment to Expectation
If you are a marketing manager at a brokerage or a senior agent responsible for your own lead generation, you have likely noticed the shift. The conversation around AI in real estate has moved past the "should I try it?" phase into something more concrete. The data now supports what early adopters have been saying for the past two years: AI tools are producing measurable, attributable results in listing presentation, lead conversion, and content distribution.
The problem is that most of the information available to practitioners is either vendor-promotional or too vague to act on. A tool company will tell you its product "increases leads" without specifying the baseline, the time frame, or the sample size. A blog post will cite a single impressive statistic without naming the source. For a professional who needs to justify a budget increase or a workflow change to leadership, that kind of content is useless.
This article takes a different approach. It synthesizes attributed data from the National Association of Realtors (NAR), Zillow, Inside Real Estate, MarketsandMarkets, and other industry sources into a single decision-ready benchmark brief. Every figure is sourced, every claim is caveated, and the limitations of the data are stated explicitly. The goal is to give you a defensible set of numbers you can use in a presentation, a budget proposal, or a strategic plan for the second half of 2026.
Adoption Data: How Many Agents Are Actually Using AI in 2026?
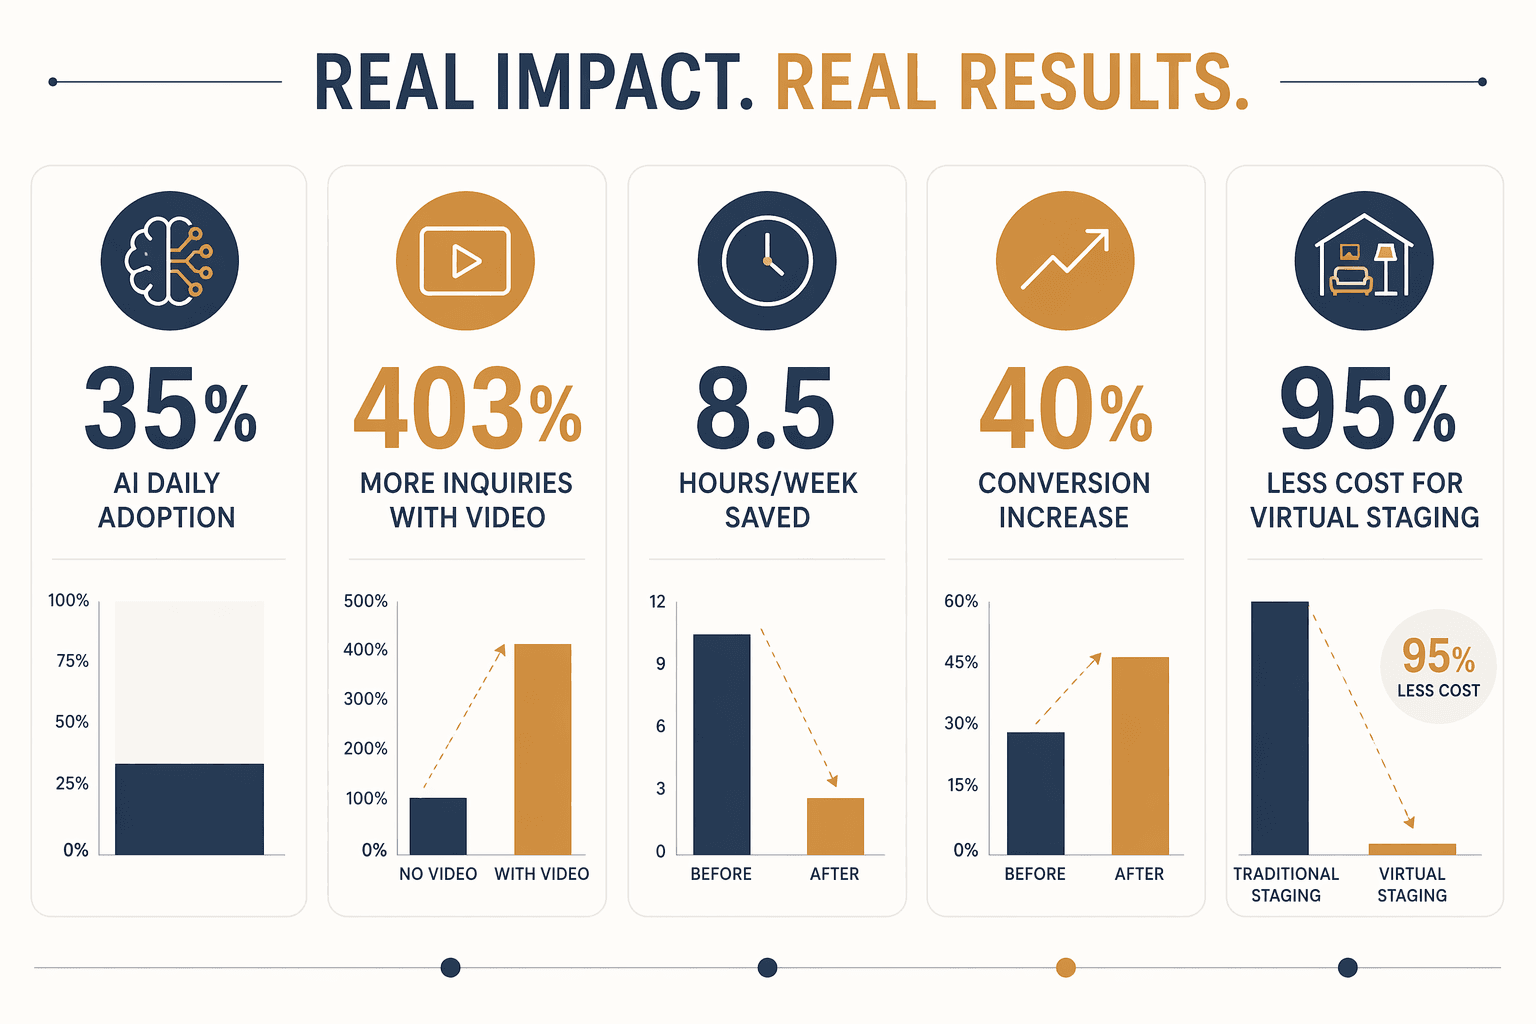
The most frequently cited statistic in the real estate AI conversation is the NAR Technology Survey finding that 35% of agents use AI tools daily as of 2025. That figure represents a tripling from 11% in 2023, and it is the headline number that most articles lead with. But the full adoption picture is more nuanced, and the differences between segments matter more than the aggregate.
According to the same NAR survey, 75% of top-performing agents — defined as those in the top quartile by transaction volume — now use AI tools. Among all agents, the figure is 49%. That gap of 26 percentage points between top performers and the general agent population is the most actionable data point in the entire set. It suggests that AI adoption is not evenly distributed; it is concentrated among the agents who are already outperforming their peers. Whether AI is a cause or a correlate of that outperformance is a separate question, but the correlation is strong enough to warrant attention from any agent or brokerage that wants to compete at the top of the market.
| Metric | Figure | Source | Year |
|---|---|---|---|
| Agents using AI tools daily | 35% | NAR Technology Survey | 2025 |
| Agents using AI tools daily (2023) | 11% | NAR Technology Survey | 2023 |
| Top-performing agents using AI | 75% | NAR Technology Survey | 2025 |
| All agents using AI (any frequency) | 49% | NAR Technology Survey | 2025 |
| Brokerages increasing tech budget in 2026 | 62% | Inman | 2025 |
| Growth in 'AI real estate video' searches | 425% YoY | Google Trends | 2025-2026 |
The brokerage-level data reinforces the trend. A 2025 Inman survey found that 62% of brokerages plan to increase their technology budgets in 2026. That is not a speculative projection — it is a stated intention from the people who control purchasing decisions. Meanwhile, search behavior among consumers and agents tells a similar story: the search term "AI real estate video" grew 425% year over year on Google Trends between 2025 and 2026, indicating that interest is accelerating, not plateauing.
For context, these adoption rates place real estate ahead of many other verticals in B2B marketing. A separate analysis of the broader B2B marketing landscape found that while 95% of organizations report using AI in some capacity, only 26% execute it well. Real estate's 35% daily usage rate among agents suggests a higher level of active, consistent application than many other industries have achieved. But the gap between adoption and effective execution remains the critical variable.
Content Marketing ROI: What the Numbers Say About Video, Social, and AI-Assisted Content
The strongest ROI case for AI in real estate marketing comes from content production — specifically video. The data is consistent across multiple sources and years, and the magnitude of the effect is large enough to be strategically significant.
A 2024 NAR study found that listings with video receive 403% more inquiries than listings without. The same study reported that homes marketed with video sell for 6% more on average. A separate analysis from Realtor.com in 2024 found that listings with video get 157% more organic search traffic. These three figures — inquiries, sale price, and organic visibility — form a coherent ROI case: video improves discovery, increases competition among buyers, and converts that competition into higher final prices.
| Metric | Figure | Source | Year |
|---|---|---|---|
| More inquiries with video listings | 403% | NAR | 2024 |
| Higher sale price with video | 6% | NAR | 2024 |
| More organic search traffic with video | 157% | Realtor.com | 2024 |
| Higher open rates with video thumbnails in email | 26% | HubSpot | 2025 |
| Higher CTR with video thumbnails in email | 41% | HubSpot | 2025 |
| More listing appointments with 15%+ video budget | 49% | Inman | 2025 |
The email channel shows a similar pattern. HubSpot reported in 2025 that emails with video thumbnails see 26% higher open rates and 41% higher click-through rates compared to emails without. For an agent or brokerage sending weekly listing alerts, market updates, or drip campaigns, that is a meaningful lift in engagement that requires no additional ad spend.
The time-savings argument is equally compelling. NAR's 2025 survey found that agents using AI marketing tools save an average of 8.5 hours per week on content creation and follow-up. Across a 50-week working year, that is 425 hours — the equivalent of more than 10 standard work weeks. For an agent who bills their time against commissionable activities, that is not a convenience metric; it is a capacity metric.
Yet the adoption of video remains surprisingly low. Only 26% of agents consistently use video for every listing, according to the same NAR survey. That means three out of four agents are leaving the 403% inquiry advantage on the table. The gap between the data and the practice is where the opportunity lives.
Lead Conversion Impact: Speed-to-Lead, AI Nurturing, and the Cost of Slow Follow-Up

Lead conversion is where AI's impact is most measurable and most directly tied to revenue. The data here is consistent across multiple sources, and the before-and-after comparisons are stark enough to justify investment on their own.
Inside Real Estate reported in 2025 that AI-powered lead nurturing increases conversion rates by 40% compared to manual follow-up. The mechanism is straightforward: AI chatbots and automated response systems eliminate the delay between a lead's inquiry and the agent's response. Zillow's 2025 data shows that the average agent response time with an AI chatbot is under 2 minutes, compared to 8 hours without AI. That gap matters because NAR's 2025 survey found that 48% of leads are lost to slow response. If nearly half of all inbound leads are being lost to a problem that AI can solve for under $100 per month, the ROI calculation is not complicated.
| Metric | Before AI | After AI | Source | Year |
|---|---|---|---|---|
| Lead conversion rate | Baseline | +40% | Inside Real Estate | 2025 |
| Average response time | 8 hours | Under 2 minutes | Zillow | 2025 |
| Leads lost to slow follow-up | 48% | Eliminated | NAR | 2025 |
| Appointments set via AI | Baseline | +35% | kvCORE | 2025 |
The kvCORE platform reported a 35% increase in appointments set when AI was used for lead engagement. That figure aligns with the broader pattern: AI does not just speed up response times — it also improves the quality and consistency of follow-up. An AI system does not forget to follow up, does not prioritize the wrong leads, and does not get distracted during a showing. It maintains contact with every lead in the pipeline at a cadence that would be impossible for a human agent managing 50 or 100 active conversations.
The practical implication for a brokerage or team leader is that the cost of not adopting AI-powered lead response is quantifiable. If your team generates 100 leads per month and converts 5% without AI, a 40% improvement in conversion would yield 7 closed transactions instead of 5. At a $10,000 average commission, that is $20,000 per month in additional revenue — far exceeding the cost of any AI tool on the market.
Visual Marketing: Virtual Staging, Social Video, and the Cost Advantage of AI
Visual marketing is the domain where AI's cost advantage is most dramatic. The comparison between traditional and AI-powered methods is not close.
BoxBrownie reported in 2025 that virtual staging with AI costs 95% less than physical staging. For a typical three-bedroom home, physical staging can cost $2,000 to $5,000 per month. Virtual staging, by contrast, costs $100 to $300 per property. The quality difference has narrowed significantly as AI image generation has improved, and for many listings — particularly vacant properties or homes in markets where staging is not standard — the cost savings make virtual staging the rational choice.
| Metric | Traditional Method | AI Method | Source | Year |
|---|---|---|---|---|
| Staging cost | $2,000 - $5,000 per month | $100 - $300 per property | BoxBrownie | 2025 |
| Cost savings | Baseline | 95% less | BoxBrownie | 2025 |
| Social engagement (Reels vs. static) | Baseline | 67% higher | HubSpot | 2025 |
| Social shares (video vs. photo carousel) | Baseline | 12x more | Realtor.com | 2024 |
On the social media side, the engagement data favors video formats overwhelmingly. HubSpot reported in 2025 that Instagram Reels generate 67% more engagement than static posts. Realtor.com found in 2024 that listings shared as video on social media receive 12x more shares than photo carousels. For agents who are already active on social media — 77% of agents use social media for business, according to NAR's 2025 survey — shifting from static images to short-form video is the single highest-leverage content change available.
The social media platform distribution matters here. NAR's 2025 survey found that Facebook is the dominant lead generation platform for agents at 89%, followed by Instagram at 65%. The Reels engagement advantage applies primarily to Instagram, but the video-sharing advantage applies across platforms. For agents who are not yet producing video content, the barrier to entry has never been lower: AI tools can generate listing walkthroughs, property highlights, and social clips from a single photo shoot or even from existing listing photos.
Market Sizing: The $303 Billion Opportunity and What It Means for Real Estate Marketing
The macro-level market data provides context for the micro-level adoption and ROI figures. According to a Research and Markets report cited by Blott, the global AI in real estate market reached an estimated $303 billion in 2025 and is projected to grow to $989 billion by 2029, representing a compound annual growth rate of 34.4%. That growth rate places AI in real estate among the fastest-growing segments of the broader AI market.
| Metric | Figure | Source | Year |
|---|---|---|---|
| Global AI in real estate market (2025) | $303 billion | Research and Markets | 2025 |
| Projected market (2029) | $989 billion | Research and Markets | 2029 (projected) |
| Compound annual growth rate | 34.4% | Research and Markets | 2025-2029 |
| Global PropTech funding (2025) | $16.7 billion | Blott / Industry data | 2025 |
| PropTech funding YoY increase | 67.9% | Blott / Industry data | 2025 |
| Firms considering AI a strategic priority | Over 90% | Blott / Industry data | 2025 |
The PropTech funding data reinforces the trend. Global PropTech funding reached $16.7 billion in 2025, a 67.9% year-on-year increase. That is not speculative venture capital chasing a trend — it is capital being deployed into companies that are building products for a market that already exists. Over 90% of leading real estate firms now consider AI a strategic priority, according to the same report.
For a marketing manager or brokerage operations lead, the market sizing data serves a specific purpose: it provides the external validation that internal stakeholders often need. When a broker-owner asks why the marketing budget should include an AI tool line item, the answer is not just "because it works" — it is "because the market is growing at 34.4% CAGR and 90% of our competitors consider this a strategic priority." The market data turns a tactical recommendation into a strategic argument.
What the Data Means for Agent Strategy in H2 2026
The data in this article supports four strategic priorities for the second half of 2026. These are not speculative recommendations — they are direct implications of the numbers presented above.
- Prioritize video-first content production. The 403% inquiry advantage, 6% price premium, and 157% organic traffic lift are not marginal improvements. They are structural advantages that compound over time. If your brokerage or team is not producing video for every listing, you are leaving a measurable revenue opportunity on the table. AI tools that generate listing videos from photos or single walkthroughs have lowered the production barrier to near zero.
- Implement AI-powered lead response immediately. The 48% lead loss rate from slow follow-up is the single largest preventable revenue leak in most real estate businesses. AI chatbots and automated response systems cost less than a monthly coffee budget for a team and can reduce response time from 8 hours to under 2 minutes. The 40% conversion lift reported by Inside Real Estate is consistent across multiple vendor studies and is large enough to justify same-week implementation.
- Invest in virtual staging for vacant or challenging properties. The 95% cost savings compared to physical staging makes virtual staging a no-regret investment for any listing that would otherwise go unstaged. The quality of AI-generated virtual staging has improved to the point where buyer surveys show no significant preference between virtual and physical staging in most price segments.
- Allocate at least 15% of your marketing budget to AI tools and video production. Inman's 2025 data shows that agents who allocate at least 15% of their budget to video report 49% more listing appointments. The same logic applies to AI tools: the agents who invest in AI are the ones who are seeing the 8.5 hours/week time savings and the 40% conversion improvements. Budget allocation is a leading indicator of results.
For readers who need a framework to measure and defend these investments internally, our AI-driven marketing ROI accountability playbook provides a step-by-step methodology for tracking, attributing, and presenting AI marketing results. For real-world examples of how brands across industries have achieved similar outcomes, our sourced case study collection documents specific implementations with attributable results.


Comments
Join the discussion with an anonymous comment.