
Taco Bell Enchirito Deal: Marketing Strategy & Crisis Measurement
When a public health crisis destroyed Taco Bell foot traffic overnight, the $1 Enchirito deal became a natural experiment in measuring crisis-response campaign effectiveness without first-party data. This case shows media buyers how to triangulate Placer.ai foot traffic, YUM stock movement, and social engagement to evaluate performance when redemption numbers and paid-ad spend are unavailable.
- Platform
- Meta Ads
- Campaign type
- Social
- Spend range
- Not disclosed
- Timeframe
- July 0-22, 2026
- Foot traffic (Placer.ai)
- 0% decline
- Verdict
- mixed
- Industry vertical
- Fast food / QSR
- Last reviewed
- 0-07-25
The useful question around Taco Bell’s Enchirito deal is not whether a $1 menu item was a clever piece of crisis theater. It is what a media buyer could responsibly say while the health investigation was still active, stores had just taken a sharp traffic hit, and the brand had not disclosed redemptions, spend, reach, or post-offer recovery.
That is the part that makes the case worth keeping. On July 17, after the FDA named Taco Bell in connection with a cyclospora outbreak, CNN reported Placer.ai data showing the chain’s daily foot traffic fell nearly 31% versus a typical Friday average; July 18 was down about 30% on the same basis. As of July 21, CDC had reported 4,173 lab-confirmed cyclosporiasis cases and more than 7,400 additional unconfirmed cases, so the $1 Enchirito was not running in a resolved-risk environment. It was running while customers still had a reason to stay away. [1]
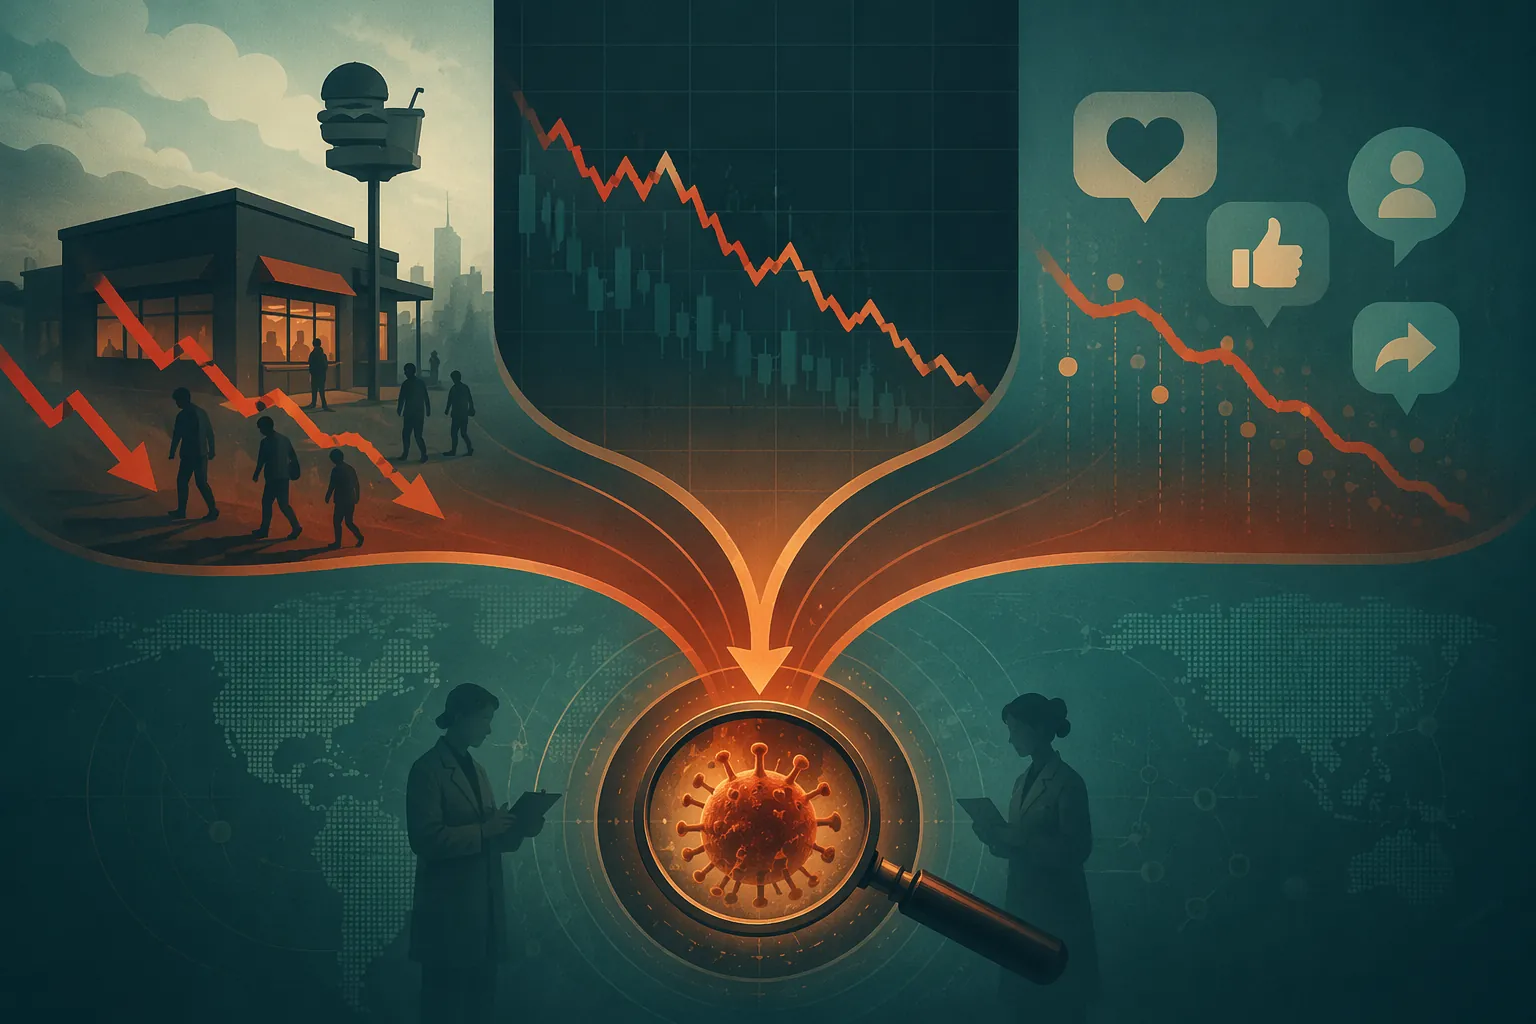
By July 22, the brand had moved from reassurance into a low-friction visit prompt: a lettuce-free $1 Enchirito, announced publicly through an Instagram Reel and available to all guests through 11:59 p.m. PT. A Rewards-only, app-exclusive phase had started one day earlier, on July 21. [2]
The Dated Sequence Matters More Than the Menu Item
A crisis-response read needs a clock before it needs a dashboard. Without the sequence, every signal gets too easy to overinterpret: social comments become demand, foot traffic becomes campaign lift, and a stock move becomes proof of customer behavior.
| Date | Event | Measurement Meaning |
|---|---|---|
| July 17 | FDA naming; Taco Bell traffic reported down nearly 31% versus typical Friday average | Pre-response shock baseline, not campaign performance [1] |
| July 18 | Traffic still down about 30% on the same basis | Second-day confirmation that the decline was not a one-day reporting artifact [1] |
| July 21 | CEO Sean Tresvant posts trust message; Rewards-only app access begins | Separate trust signal and first controlled offer window [1][2] |
| July 22 | Public $1 Enchirito offer opens all day; Instagram Reel announcement goes live | First broad-access response moment, but without disclosed reach, spend, or redemptions [2] |
The campaign mechanics are important only because they define what could have been measured. The July 22 deal did not require a coupon, was capped at five per order, and was paired with a separate $1 Nacho Fries add-on for app users. [1][3] That structure creates at least two populations: people exposed to the public offer and people already close enough to the brand to use the app. If Taco Bell later reported only total Enchirito redemptions, that number still would not cleanly answer whether the public campaign brought back hesitant customers.
Tresvant’s July 21 LinkedIn line, “We aren’t entitled to your loyalty. We earn it one meal at a time,” belongs in the same measurement file, but not as conversion evidence. It clarifies the job of the push: restore enough trust to make a lettuce-free, discounted visit thinkable. It does not establish that trust was restored. [1]
The Foot-Traffic Number Is the First Signal, and the First Problem
The nearly 31% decline is the number any buyer would circle first. It is operational, not abstract. It points to fewer people crossing thresholds, fewer crews serving normal volume, and a business problem that paid media cannot hide inside CPMs.
But this is also where the notebook opens. A separate report described the July 17 traffic decline as nearly 19%, also attributed to Placer.ai. [4] That gap is not a throwaway caveat. It is the difference between a severe traffic shock and a still-serious but less dramatic one. In a live crisis dashboard, that kind of mismatch can become false comfort if the team chooses the friendlier number without asking what changed underneath it.
The most likely explanation is baseline construction: one report may be comparing July 17 to a typical Friday average, while another may be using a different averaging window or normalization method. The available materials do not give enough detail to reconcile the two figures. That means a responsible read should show the range, label the baseline uncertainty, and avoid turning either number into a precise loss estimate.
| Reported Decline | Attributed Data Source | Likely Issue | How to Use It |
|---|---|---|---|
| Nearly 31% on July 17; about 30% on July 18 | Placer.ai via CNN | Compared with typical Friday average | Use as the sharper operational shock signal [1] |
| Nearly 19% on July 17 | Placer.ai via separate reporting | Different baseline window may be involved | Use as a lower-bound caution, not a contradiction to ignore [4] |
For the Enchirito campaign, the missing piece is just as important as the decline itself: the supplied public materials do not include post-July 22 Placer.ai recovery data. Foot traffic can tell a buyer whether visits stopped falling, stabilized, or rebounded after the offer. In this case, it cannot yet tell that story from the available record.
A Three-Proxy Dashboard, With the Caveats Next to the Numbers
When first-party conversion data is unavailable, the best available read comes from triangulation. Not because triangulation makes the result clean. It simply keeps one imperfect signal from pretending to be the whole story.
| Proxy Stream | What It Can Show | What It Cannot Show Here |
|---|---|---|
| Placer.ai foot traffic | Whether store visits fell, stabilized, or recovered around the crisis and offer window | No disclosed post-July 22 recovery data in the supplied materials; baseline conflict remains |
| YUM stock movement | Investor pressure after the FDA naming and before any measurable confidence rebound | No direct customer behavior; no post-deal recovery read in the supplied materials |
| Instagram engagement | Visibility, public response, and comment sentiment around the public announcement | No impressions, paid-boost status, reach, redemption, or purchase behavior |
The stock signal is useful because it measures pressure from a different audience. GuruFocus reported that Yum! Brands stock fell approximately 9% to 10% in the week after the FDA naming and cited a P/E ratio of 23.53. [5] That does not say customers avoided Taco Bell because of the promotion or came back because of it. It says investors had already marked down the parent company during the crisis window.
A buyer should treat that as a financial baseline, not an attribution channel. If traffic later improved while the stock continued to lag, the customer and investor reads would be diverging. If both recovered after the offer, that would still be correlation, not proof that the Enchirito caused the recovery. The supplied materials do not include a post-July 22 stock recovery read, so the case stops at pressure, not rebound.
The social signal has the opposite problem. The Instagram Reel created a visible public response and generated thousands of comments within 48 hours, but Instagram does not disclose the full impression count or whether the post was boosted with paid spend. [2] A comment thread can show attention and anxiety. It can also show bargain interest, skepticism, jokes, complaint volume, or a loud minority. It cannot be treated as demand unless it is connected to reach and downstream behavior.
That distinction matters for paid ads. If the Reel was purely organic, then the $1 offer functioned mainly as owned-channel crisis response with app mechanics attached. If it was boosted, then paid media entered the system, but without spend, audience, frequency, and incrementality reporting, no outside analyst can separate paid distribution from organic pickup. Either way, the public evidence supports visibility, not attributed sales.
What a Cleaner Paid-Mobile Benchmark Would Look Like
There is a useful older contrast. In a 2016 PlaceIQ study discussed by AdExchanger, 41% of people exposed to a Taco Bell mobile ad visited a store within two days. [6] That number should not be imported into the 2026 Enchirito crisis as an expected response rate. The conditions are too different: a normal mobile-ad exposure study is not the same as a food-safety event, a trust message, and a low-price offer running while case counts are still being confirmed.
The benchmark is still valuable because it shows what a cleaner measurement case contains: defined exposure, a visit window, and a way to connect the two. The Enchirito case has the visit shock and the offer date, but it lacks verified exposure, paid spend, and redemptions. That is why the right comparison is methodological, not performance-based.
The Operating Read a Buyer Could Make on July 23
On July 23, the clean answer would be unavailable. The useful answer would be bounded.
- The crisis created a measurable store-traffic shock, but the publicly reported decline range depends on baseline choice.
- The $1 Enchirito offer created a dated intervention point after the shock, with an app-only phase followed by a public all-day phase.
- The offer was designed to reduce the friction of a return visit, not to prove the underlying health issue had been resolved.
- Investor pressure was visible before the public offer, but the available materials do not show whether markets rewarded the response afterward.
- Instagram engagement showed public attention, but not reach, paid amplification, redemption, or store visits.
That read is less satisfying than a conversion report, but it is more honest than a victory slide. The practical move would be to keep the three streams separate until enough post-offer data exists to compare them. If traffic began recovering after July 22, the next question would be whether the recovery was stronger among locations, regions, or cohorts more exposed to the offer. If social sentiment improved but traffic stayed depressed, the campaign may have created conversation without restoring behavior. If stock stabilized while visits remained weak, investor relief would not be customer recovery.
The Enchirito deal is useful because it exposes the measurement problem instead of solving it too neatly. A discounted, lettuce-free item can create a testable intervention point during a traffic collapse. It cannot, by itself, prove that customers trusted the brand again. The responsible standard is directional: show the shock, mark the intervention, separate the proxy streams, keep the baseline conflict visible, and stop short of claiming lift until behavior after the offer is actually measured.
References
- Hungry for customers, Taco Bell is offering $1 lettuce-free deals — CNN, July 22, 2026
- Taco Bell offers $1 lettuce-free enchirito to win back customers post-parasite — Ad Age, July 22, 2026
- Taco Bell Offers $1 Enchirito on July 22, 2026 — Brand Eating
- Taco Bell offering $1 lettuce-free deal amid cyclospora outbreak — USA Today, July 22, 2026
- Taco Bell (YUM) Launches $1 Enchirito to Attract Customers Amid Lettuce Crisis — GuruFocus, July 22, 2026
- Taco Bell Takes Early Adopter Approach To Digital To Drive Sales — AdExchanger
Built on this evidence
No Bidding tactic or Creative record currently cites this case file. Compare it against other results in Benchmarks.
Related benchmark reading
Report a corroborating or contradicting result
Seeing something different in your own account? Feed the data-integrity loop instead of leaving an open comment.