
Real Benchmarks for India Tiger Safari Ads in 2026
Aggregated travel ROAS benchmarks mislead tiger safari advertisers. This article maps platform-specific data (PMax, AI Max, Advantage+, YouTube) to the extended-booking-window niche and delivers a realistic benchmark range for India tiger safari campaigns.
- Platform
- Google Ads
- Campaign type
- Performance Max
- Spend range
- Various
- Timeframe
- Q0 2026
- ROAS
- 0x
- Verdict
- mixed
- Industry vertical
- Travel
- Last reviewed
- 0-07-29
The wrong number usually arrives first: Google Ads travel ROAS at 2.8x, Meta Ads travel ROAS at 2.3x. Those Ryze AI 2026 figures come from a benchmark set covering more than 15,000 advertisers, and they are useful for one thing in an India tiger safari budget meeting: showing how quickly “travel” becomes too broad to buy against.[1]
A campaign selling the best India national parks for tiger sightings in 2026 is not competing in the same buying pattern as an airport hotel, a weekend OTA deal, or a flight flash sale. The buyer may be comparing Bandhavgarh against Kanha, checking guide quality, reading reviews, timing park permits, coordinating international flights, and asking whether the itinerary justifies a premium package price. That does not make automation useless. It makes the benchmark row dangerous.
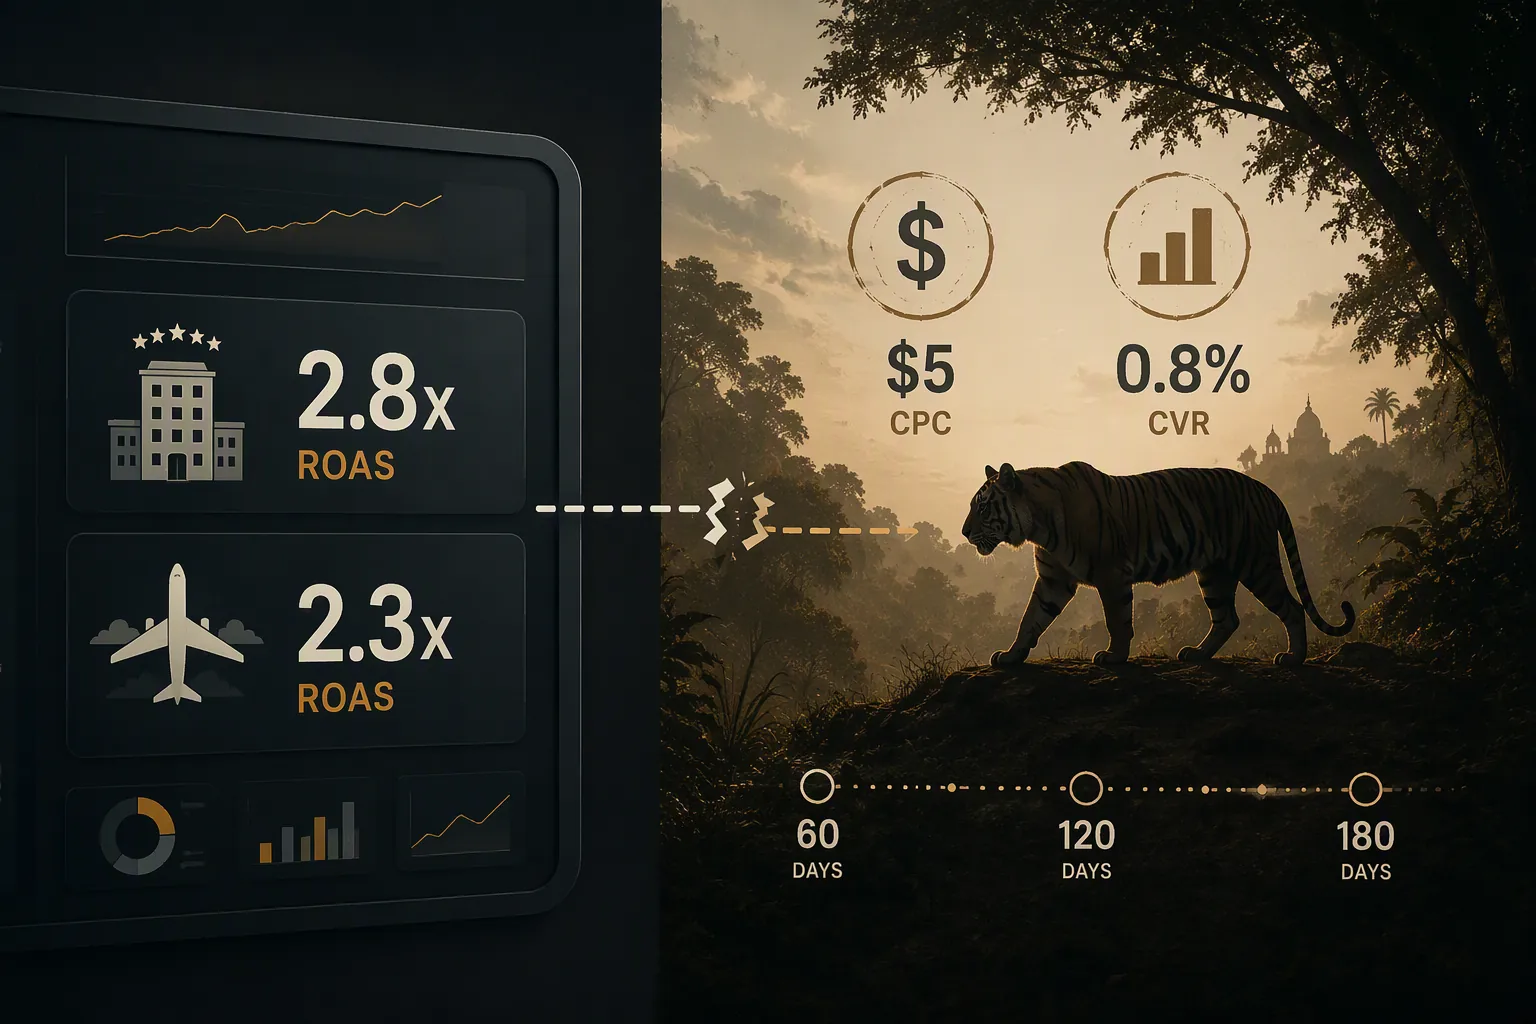
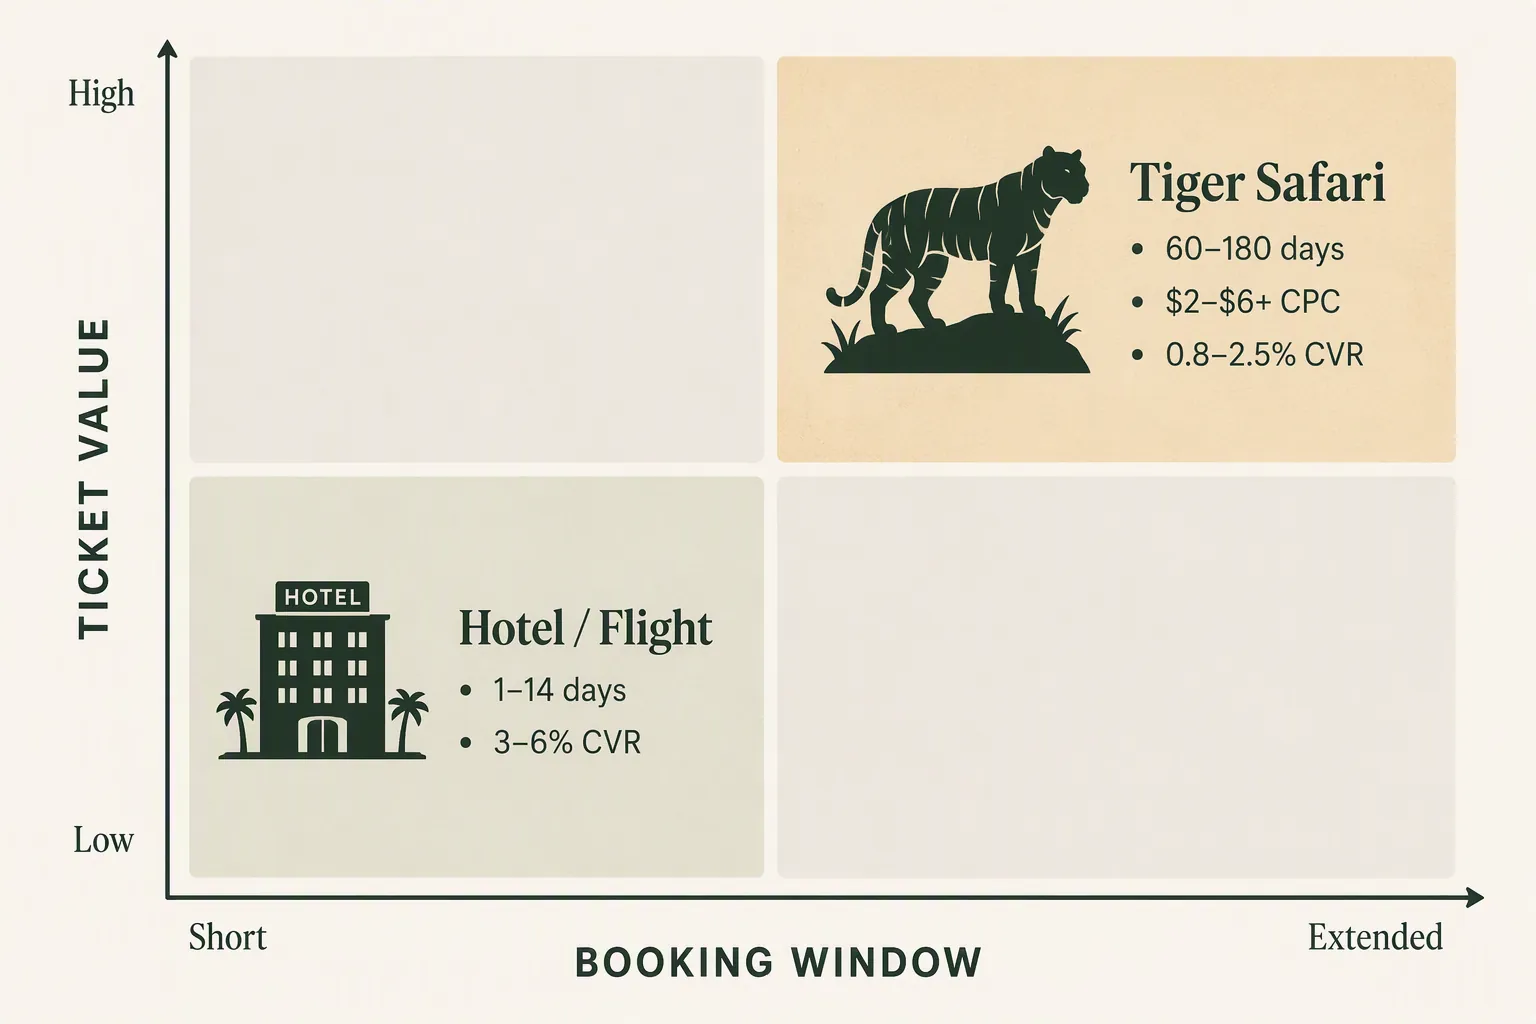
The usable starting point is not an all-travel average. It is the segment map. FoundryCRO’s 2026 travel benchmark model separates luxury or extended-window travel from impulse travel: the extended-window segment carries 60–180+ day booking windows, 0.8–2.5% conversion rates, and $2–$6+ CPC tolerance, while impulse hotel and flight demand can sit around 3–6% conversion rates.[2] That gap is the benchmark problem.
The Segment Map Beats the Travel Average
If a tiger safari account is judged against a generic 2.8x or 2.3x travel ROAS target, the account can look inefficient while behaving exactly as its category requires. The early clicks are expensive because the intent is specific. The conversion rate is lower because the purchase is researched. The lag is longer because travel dates, park access, lodges, guides, and companions have to align.
| Travel segment | Buying behavior | Planning range supported by the research | How to treat it in a tiger safari plan |
|---|---|---|---|
| Impulse hotels / flights | Shorter consideration, easier price comparison, more direct booking intent | 3–6% CVR for impulse travel in FoundryCRO’s model | Do not use as the main benchmark for India tiger safari packages |
| Luxury / extended-window travel | Longer research path, higher ticket value, reviews and itinerary trust matter more | 60–180+ day booking window, $2–$6+ CPC tolerance, 0.8–2.5% CVR | Use as the closest published planning quadrant for tiger safari campaigns |
| India tiger safari tours | High-value wildlife itinerary with seasonal, permit, guide, lodging, and international planning friction | No first-party India tiger safari campaign data available here | Benchmark by mapping to the extended-window quadrant, then label all platform figures by source limits |
The practical consequence is uncomfortable but clarifying: a $5 CPC is not automatically a problem in this segment, and a 1.2% lead or booking conversion rate is not automatically a failure. In a flash-sale flight account, those numbers would invite a hard look. In a premium safari account, they may simply be the cost of reaching a buyer who is still building confidence.
That does not mean every expensive click deserves patience. It means the account has to be read by intent quality, lead quality, assisted revenue, and booking-window maturity. A Q3 2026 campaign built for Q1 2027 arrivals should not be forced to prove itself on the same return window as same-week hotel demand.
What PMax Actually Proves
Performance Max is the most tempting place to overstate the evidence because the result is clean and the product is relevant. Google says Performance Max for travel goals drove 18% more incremental conversions, but the published claim is hotel-specific.[3] That last clause matters. Hotels have inventory feeds, location-based intent, and booking behaviors that do not map neatly onto a multi-day tiger safari itinerary.
For a safari operator, PMax is still worth planning around. It can surface demand that a manually built search structure may miss: travelers looking by park, by wildlife season, by lodge type, by broader India itinerary, or by “best chance of tiger sightings” language rather than a neat tour-package keyword. The mistake is treating Google’s hotel lift as a safari ROAS forecast.
OYO adds another useful but limited calibration point. In Google and Kantar’s India travel material, OYO is reported as seeing 50% higher ROAS and 25% lower CPA using Performance Max.[4] That is a serious result for an India travel advertiser, and it supports the case that PMax can improve allocation in the market. It is also budget hotel behavior. A budget hotel conversion can happen under far less uncertainty than a premium safari package, so the OYO case should support testing and structure, not become the tiger safari target.
AI Max Has a Budget Trade-Off Hiding Inside the Lift
AI Max belongs in the plan, but not as a magic layer that raises every downstream metric at once. The ppc.land April 2026 analysis reports two different claims: Google’s cited figure of 7% more conversion volume at similar CPA, and independent testing showing roughly 35% lower ROAS.[5] Those are not interchangeable numbers. One is a volume-and-CPA story; the other is a return-efficiency warning.
The warning gets sharper in tiger safari buying because the CPC base is already high. A volume lift that looks manageable at a low CPC can become expensive when the account is paying $2–$6+ per click and waiting months for the best leads to mature. If AI Max expands into softer research queries, the account may get more signals without getting proportionally more near-term revenue.
That does not argue for keeping AI Max off the account. It argues for separating tests. Use it where query expansion, creative matching, and landing-page interpretation can find qualified safari demand that exact-match structures miss. Hold out cleaner control periods or campaign groups where possible. Judge the test on lead quality, revenue maturation, and assisted value, not only on the first visible CPA number.
Meta Advantage+ Is the Number to Flag, Not Follow
The Meta number that will make its way into decks is the 12.9x travel ROAS claim attributed to Triple Whale. It should carry a visible caution flag, not a quiet footnote.[6] High booking values can make ROAS look elegant even when the underlying buying economics are uneven. A few large purchases can flatter the average. Attribution windows can reward the platform for demand that matured elsewhere. The result may describe some advertisers in the dataset; it does not become a realistic benchmark for India tiger safari campaigns.
Advantage+ can still earn budget in this niche, especially when creative has enough proof: park-specific itineraries, lodge quality, guide credentials, real review language, and seasonal clarity. But the planning role is different from a bottom-funnel Google search campaign. Meta may create or refresh demand before the buyer comes back through branded search, email, WhatsApp, a travel advisor, or a direct inquiry form.
For budget defense, the safe move is to exclude 12.9x from the core benchmark set. Use it only as directional evidence that travel purchases can show high platform-reported ROAS under certain conditions. Do not use it to set the expected return for a safari tour operator.
YouTube Is More Useful Before the Last Click
YouTube’s value in this category is easier to understand if it is not forced into a last-click ROAS box. Google and Kantar report that 68% of India travelers use YouTube for trip inspiration.[4] That is a planning signal for discovery, comparison, and confidence-building. It is not proof that a YouTube campaign for tiger safaris should be held to the same immediate ROAS standard as high-intent search.
MakeMyTrip’s reported 16% business uplift in the same Google/Kantar India material supports the broader point that video and digital travel media can influence measurable business outcomes in India travel.[4] It still does not answer the narrow question a safari media buyer has to answer: how much last-click revenue should YouTube carry for a high-consideration wildlife package?
The better use is to treat YouTube as an assisted-demand channel. It can show the difference between parks, explain why private guiding costs more, make seasonality tangible, and let reviews or expert narration do some of the trust work before a search click ever happens. Its performance should be read through brand search lift, engaged site visits, view-through assisted conversions, remarketing pool quality, and eventual inquiry quality. A neat bottom-funnel ROAS target will undercount what the channel is supposed to do.
The Platform Evidence, Sorted by Usefulness
| Platform or source | Published number | What it actually supports | How to use it for tiger safari campaigns |
|---|---|---|---|
| Ryze AI travel averages | Google Ads 2.8x ROAS; Meta Ads 2.3x ROAS | Broad travel-category comparison across a large advertiser set | Use as a foil only; too aggregated for premium safari planning |
| FoundryCRO segment model | 60–180+ day booking window; $2–$6+ CPC; 0.8–2.5% CVR for luxury or extended-window travel | Closest published behavioral fit for tiger safari campaigns | Use as the core planning framework |
| Google PMax for travel goals | +18% incremental conversions | PMax can add conversions in hotel travel campaigns | Use to justify a controlled PMax test; do not extrapolate the lift directly to tours |
| OYO PMax case | 50% higher ROAS; 25% lower CPA | PMax can improve performance for an India travel advertiser | Directional only; OYO is budget hotels, not premium wildlife tours |
| AI Max | +7% volume at similar CPA cited by Google; about 35% lower ROAS in independent testing | Expansion may increase volume while weakening return efficiency | Test with guardrails, especially where CPCs are already high |
| Meta Advantage+ / Triple Whale | 12.9x travel ROAS | Some travel advertisers report very high platform ROAS | Do not use as a safari benchmark; likely skewed by booking value and attribution effects |
| YouTube / Google-Kantar India | 68% of India travelers use YouTube for trip inspiration | Video matters for inspiration and consideration | Measure assisted demand, not only last-click ROAS |
A Realistic Planning Range for Q3 2026 Budgets
For India tiger safari advertising, the most defensible planning range is not a single ROAS target. It is a set of assumptions tied to buying behavior:
- CPC: Plan tolerance around the extended-window travel range of $2–$6+, then segment by intent rather than panicking at the blended average.
- CVR: Treat 0.8–2.5% as the more relevant published range for premium safari demand, not the 3–6% impulse travel range.
- Booking window: Expect 60–180+ days for serious buyers, and avoid judging Q1 2027 arrivals only by short-window Q3 2026 revenue.
- Google ROAS: Do not use the 2.8x travel average as the target. Use PMax and AI Max tests to find qualified incremental demand, then evaluate against matured revenue.
- Meta ROAS: Do not use the 12.9x travel claim or the 2.3x aggregate as the benchmark. Read Meta through assisted demand, retargeting quality, and high-value inquiry contribution.
There is one broader measurement lesson worth borrowing from larger travel organizations. BCG’s 2025 survey of 40 travel marketing leaders found that custom incrementality measurement tied to revenue management delivered ROI gains above 20%.[7] That does not hand a safari operator a plug-and-play benchmark. It does support the idea that the account should be judged by incrementality and revenue quality, not by platform-reported averages alone.
Reviews also deserve more weight in the media plan than they usually get in benchmark conversations. Trust and proof do real work when the buyer is considering a high-value trip months in advance. TrustYou’s finding that travelers are 3.9x more likely to book at an equal price based on review scores is useful as a calibration point, but not as a cited benchmark here without a usable source URL.
What to Ignore, What to Label, What to Use
Ignore the broad Google 2.8x and Meta 2.3x travel ROAS figures when setting the main tiger safari target. They are too blended to represent long-window, high-value wildlife travel. They can stay in the appendix as market context, not in the budget recommendation.
Label PMax evidence as hotel-specific unless the account has its own safari results. The +18% incremental conversion claim and the OYO case both support testing PMax seriously, especially in India travel, but neither proves what a DMC or safari tour operator should earn from a premium itinerary campaign.
Label AI Max as an expansion trade-off. If it brings 7% more volume but risks lower ROAS, that trade-off has to be visible before budgets move. In this category, more volume is not automatically better; more qualified high-intent volume is.
Exclude the 12.9x Meta travel ROAS claim from budget justification. It may be useful as a reminder that high-value travel transactions can produce big reported returns, but it is too vendor-shaped and too likely to be skewed by booking value to anchor a tiger safari forecast.
Use FoundryCRO’s extended-window quadrant as the planning base: 60–180+ day booking windows, $2–$6+ CPC tolerance, and 0.8–2.5% CVR. Then let the account’s own cohort data decide whether the mature ROAS target should tighten or loosen. Until there is first-party India tiger safari campaign data, that is the cleanest defensible benchmark set: segment-specific enough to be useful, and cautious enough not to pretend hotel and flight behavior can price a safari buyer.
References
- ROAS Benchmarks by Industry 2026: Google & Meta, Ryze AI, 2026.
- Travel & Hospitality Marketing Benchmarks 2026, FoundryCRO, 2026.
- Performance Max for travel goals, Google.
- Travel trends and marketing in India, Google/Kantar, 2026.
- AI Max analysis, ppc.land, April 2026.
- Triple Whale travel ROAS benchmark, Triple Whale.
- Five Ways to Boost Marketing ROI Across Travel, BCG, 2026.
Built on this evidence
No Bidding tactic or Creative record currently cites this case file. Compare it against other results in Benchmarks.
Related benchmark reading
Report a corroborating or contradicting result
Seeing something different in your own account? Feed the data-integrity loop instead of leaving an open comment.