
Tesla's FSD Numbers: An AI Adoption Benchmark for Advertisers
Tesla's shift to a $99/month FSD subscription drove 56% YoY subscriber growth and a 55% attach rate on new vehicle sales. This article breaks down those numbers and explains how advertisers can use them as an independent benchmark to pressure-test AI ad feature adoption claims from Meta, Google, and TikTok.
- Platform
- Tesla
- Campaign type
- FSD Subscription
- Spend range
- $0/month
- Timeframe
- Q0 2026
- Subscriber count
- 0M
- Verdict
- win
- Industry vertical
- Automotive
- Last reviewed
- 0-07-29
For advertisers pressure-testing Tesla's self-driving AI adoption as a benchmark, the useful part is the stack of numbers, not the mythology around the car company: 1.48 million active FSD subscribers in Q2 2026, 56% year-over-year growth, a 55% attach rate on new vehicle deliveries, and roughly $1.76 billion in annualized subscription revenue at $99 per month, assuming retention holds steady. [1][2]
The conversion event behind those numbers matters as much as the numbers themselves. Tesla moved FSD from an $8,000 to $15,000 upfront purchase into a $99/month subscription in February 2026, turning a large, delayed purchase decision into a smaller recurring one. [3] That is the part advertisers should recognize. Platforms have been asking buyers to accept similar logic across Advantage+, Performance Max, AI Max, and Symphony: lower the visible setup burden, let automation take more decisions, collect more usage, and make the product harder to evaluate from the outside once it becomes part of the default workflow.
The Benchmark Is the Adoption Pattern
FSD is not an ad product, and it should not be treated as one. A driver paying for assisted-driving software is making a different kind of decision than a media buyer enabling campaign automation. The comparison is useful because the commercial pattern is unusually clean: a high-friction AI feature became easier to buy, adoption moved quickly, and the revenue line became easier to model.
| Signal | Tesla FSD benchmark | Why advertisers should care |
|---|---|---|
| Friction event | FSD shifted from an $8,000-$15,000 upfront purchase to a $99/month subscription in February 2026. | A real adoption claim should be tied to a change that made saying yes materially easier. |
| Adoption count | 1.48 million active FSD subscribers in Q2 2026. | A platform lift story is weaker when it has no denominator for who actually opted in. |
| Growth rate | 56% year-over-year subscriber growth, with Q1 2026 subscribers reaching 1.28 million. | Adoption should be measured against the base it is growing from, not just described as momentum. |
| Attach rate | 55% attach rate on new vehicle deliveries. | Point-of-sale attachment is different from installed-base penetration, and that distinction matters. |
| Revenue translation | Approximately $1.76 billion annualized run rate at $99/month, assuming stable retention. | Usage becomes more credible when it can be connected to monetization, retention, or budget flow. |
That last row needs the caveat in the same breath as the math. The $1.76 billion run rate is 1.48 million subscribers multiplied by $99 and then by 12 months. It is not a disclosed full-year revenue number, and it depends on stable retention, undisclosed subscription-term mix, and pricing that may change as Tesla says capability improves. [1][2]
The attach-rate caveat is just as important. The 55% figure applies to new vehicle deliveries, not every Tesla already on the road. [2] That makes it a strong point-of-sale benchmark and a weaker installed-base benchmark. In ad-platform terms, it is closer to asking how many newly created campaigns launch with an AI feature enabled than asking how much of the entire advertiser base has migrated.
Why the Subscription Pivot Changed the Question
A large upfront price makes buyers postpone judgment. They wait for proof, ask whether the feature is mature enough, compare it with other uses of capital, and often do nothing. A monthly subscription changes the CFO conversation. The buyer can frame the decision as a trialable operating cost rather than a major one-time commitment.
That does not make the product better by itself. It changes who gets far enough into the product to judge it. Once adoption rises, Tesla gets more paid usage, more behavioral feedback, and a clearer recurring revenue stream. FSD paid-user growth in Q1 2026 was reported at roughly 44% sequentially, while growing nearly 10 times faster than Tesla vehicle deliveries, which is the key decoupling point for marketers watching software monetization. [4]
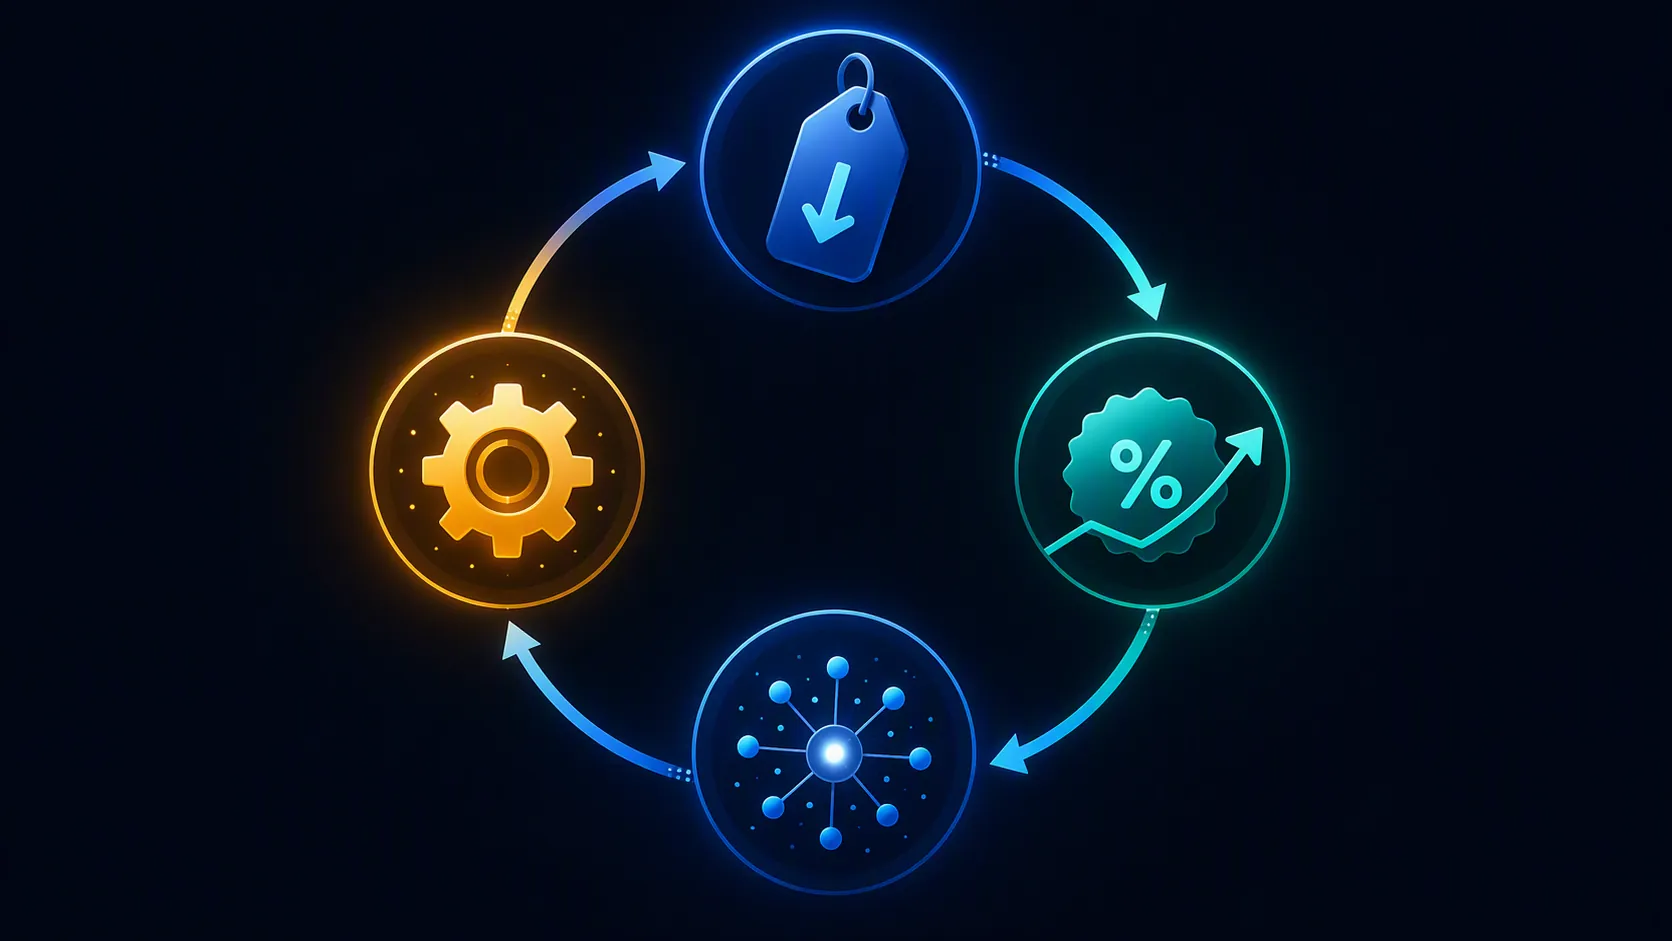
That is the sequence worth carrying into advertising conversations:
- The immediate buying risk decreases.
- More users or accounts cross the adoption threshold.
- The system receives more usage signals.
- Automation has more chances to improve or prove itself.
- The company gains room for recurring revenue, deeper defaults, or future price increases.
The advertising version is familiar. A platform removes targeting work, bundles placements, hides some controls, adds AI creative or bidding recommendations, and then reports that automated campaigns are growing. The missing piece is often whether growth came from performance, workflow pressure, default settings, reduced setup cost, or some mix of all four.
How to Use FSD as a Pressure Test for AI Ad Claims
When Meta, Google, or TikTok present an AI adoption or lift claim, the FSD benchmark gives buyers a practical set of questions. It does not prove the ad feature works. It gives the buyer a standard for whether the adoption story has the same economic shape as a real AI monetization case.
- What changed in the buying or setup flow that would plausibly increase adoption?
- Is the claim based on opt-in usage, default-on usage, eligibility, or spend flowing through an automated product?
- What is the denominator: advertisers, campaigns, impressions, conversions, spend, or new account starts?
- Is adoption growing faster than the underlying account base or spend base?
- Can the platform connect usage to revenue, retention, or budget expansion without collapsing adoption and effectiveness into one metric?
Those questions are deliberately less glamorous than a platform case study. They are also harder to dodge. A reported lift number without an attach rate says little about how widely the feature is being trusted. An adoption number without a denominator can describe almost anything. A spend share number can look strong while hiding whether advertisers actively chose the feature or inherited it through campaign defaults.
The cleanest comparison is not “FSD grew 56%, so AI campaigns should grow 56%.” That would be lazy. The better comparison is: Tesla showed a specific friction event, a visible subscriber count, an attach rate at the moment of purchase, and a recurring-revenue translation. If an ad platform wants the same confidence, it should be able to show the same shape of evidence.
Where Meta, Google, and TikTok Fit
Advantage+, Performance Max, AI Max, and Symphony all sit on the same broad platform promise: give up some manual control and the machine will find better combinations of audience, creative, bid, placement, or format. The buyer’s job is not to reject that promise on sight. It is to separate a plausible adoption loop from a polished rollout story.
For Meta, the key question is whether Advantage+ adoption is being measured at the campaign level, spend level, advertiser level, or by eligibility. Those are not interchangeable. A small number of large accounts can move spend share quickly without proving broad account-level adoption.
For Google, Performance Max and AI Max raise a different denominator problem. If automation becomes the default path for inventory access, the adoption number can start to reflect distribution architecture as much as advertiser conviction. That does not make the product ineffective. It means adoption and performance need to be discussed separately, especially when buyers are already watching rising Google Ads costs and more AI-managed auction layers through analyses such as Alphabet Q2 earnings and Google Ads costs.
For TikTok, Symphony pushes the analysis closer to creative operations. The question is not only whether advertisers use AI-generated or AI-assisted assets, but whether usage changes production cadence, testing volume, review burden, or approval risk. Adoption can be real even before effectiveness is fully proven, but it should be named as adoption rather than smuggled into a lift claim.
This is where Tesla’s benchmark is most useful. It forces the platform conversation back to mechanics. Did the product team remove a real barrier? Did customers respond at a measurable rate? Is the company disclosing enough to tell whether usage is spreading beyond the easiest early adopters?
Adoption Is Not the Same as Effectiveness
Tesla’s FSD subscription growth is an adoption and monetization benchmark. It is not evidence that any ad-platform AI feature will improve ROAS, CPA, incrementality, or creative quality. That distinction is not academic. Platform reps often move too easily from “advertisers are using this” to “this works,” especially when the feature is bundled into a broader campaign type.
The reverse mistake is also common: assuming strong adoption must be forced. Sometimes a product team removes enough friction that the adoption curve changes for perfectly rational reasons. Tesla’s subscription pivot is a useful reminder that a lower upfront commitment can unlock demand without requiring a conspiracy theory about coercion.
For advertisers, the disciplined position is to ask for both layers. Adoption evidence should include the friction event, attach rate, denominator, and growth rate. Effectiveness evidence should include the test design, incrementality standard, holdout logic, and whether the result survives budget, audience, and creative constraints.
The Caveats Make the Benchmark Stronger
The FSD data is useful because it is specific enough to argue with. The subscriber count is tied to Q2 2026 earnings coverage, while the ARR estimate, attach-rate scope, subscription-term mix, and possible future pricing changes all require care. Those limits keep the benchmark practical rather than promotional. [1][2]
Those limits are exactly why the benchmark travels well into advertising. A good benchmark is not a slogan. It gives the buyer enough structure to ask better questions and enough caveats to avoid overclaiming. The same standard should apply to AI ad tools, especially as platforms spend heavily on AI infrastructure and nudge more budget toward automated products, a pattern explored in Big Tech AI capex and ad costs.
There is also a risk-side companion to the monetization story. More autonomy can create better workflows, but it can also make failure harder to inspect when systems act outside buyer expectations. That is why the FSD subscription story belongs next to analyses of Tesla phantom braking and AI ad failures and rogue AI models in ad platforms, not instead of them.
The Practical Read
Tesla’s FSD subscription data does not validate Meta’s, Google’s, or TikTok’s AI claims. It gives buyers a cleaner outside benchmark than another platform survey or selective lift study. The strongest part is the chain: lower upfront risk, faster opt-in, visible attach, recurring revenue, and software growth moving faster than the underlying hardware cycle.
When the next AI ad feature arrives with a lift percentage and a confident adoption line, the useful response is not cynicism. It is a short evidence request: show the friction event, show the attach rate, show the denominator, show whether usage is outpacing the base, and keep adoption separate from effectiveness.
References
- Not A Tesla App coverage of Tesla Q2 2026 earnings — Not A Tesla App.
- SaaS Rise coverage of Tesla FSD subscription attach rate — SaaS Rise.
- Teslarati coverage of Tesla's February 2026 FSD subscription-only move — Teslarati.
- Basenor coverage of Tesla Q1 2026 FSD subscriber growth — Basenor.
Built on this evidence
No Bidding tactic or Creative record currently cites this case file. Compare it against other results in Benchmarks.
Related benchmark reading
Report a corroborating or contradicting result
Seeing something different in your own account? Feed the data-integrity loop instead of leaving an open comment.