
The Howard-McDonald's Sponsorship as a Local DMA Channel
Analyze the Howard-McDonald's athletics sponsorship as a local franchisee-funded DMA-level ad buy, and learn how to measure sponsorship ROI without disclosed financial terms using OOH attribution proxies and franchisee budget structures.
- Platform
- OOH
- Campaign type
- Sponsorship
- Spend range
- Local franchisee co-op
- Timeframe
- Q0 2026
- Visitation lift
- Not yet measured
- Verdict
- Mixed
- Industry vertical
- QSR
- Last reviewed
- 0-07-24
The useful way into the Howard University-McDonald's sponsorship is not the ribbon-cutting language. It is the funding path. Howard Athletics announced a multi-year partnership with McDonald's backed by 50 local owner-operators in the Capital Business Unit, a footprint described as 468 restaurants across Washington, DC, Baltimore, and the Eastern Shore; the public announcement did not disclose the financial terms.[1][2]
That structure changes the media question. This is not cleanly a national McDonald's brand-halo story, even if the logo is national and the press release reads like partnership communications. For a buyer trying to compare the spend with Performance Max, Advantage+, Symphony, paid social, search, or local OOH, the more relevant classification is local co-op media inside a defined market footprint.

The missing dollar value matters, but it does not make the sponsorship impossible to evaluate. It makes the evaluation less like platform ROAS and more like local out-of-home attribution: define the exposed audience, compare it with a plausible control, watch restaurant visitation, and be honest about what the model can and cannot prove.
Start With the Budget Owner, Not the Logo
A national logo can hide a local budget. In this case, the public materials tie the partnership to local McDonald's owner-operators in the Capital Business Unit, not simply to a national corporate media line.[1][2] That does not tell us which ledger carried each dollar, how the contribution was split, or whether every restaurant in the footprint bore the same effective burden. It does tell us enough to avoid the wrong benchmark.
If the money is coming from local operators, the practical comparison set is not a Super Bowl brand buy or a national multicultural platform. It is the money a local group might otherwise put into radius-based paid social, search, CTV, local OOH, high-school sports, campus media, app download pushes, delivery marketplace promos, or a store-visit campaign around lunch and late night.
That distinction also changes who needs the answer afterward. A corporate communications team can live with reach, goodwill, and a few strong photos. A franchisee council or local agency team eventually has to explain whether the spend helped restaurants in the footprint. The answer does not need to be perfect. It does need to be framed before the season starts, not retrofitted after the announcement cycle is over.
| Question | What is public | What remains undisclosed | Measurement implication |
|---|---|---|---|
| Who funded the deal? | 50 local owner-operators in the Capital Business Unit are named in the announcement. | The contribution structure by operator or restaurant is not public. | Treat as local co-op or DMA-level media, not purely national brand spend. |
| What market is exposed? | The footprint is described as DC, Baltimore, and the Eastern Shore, covering 468 restaurants. | The exact activation geography and media weight by submarket are not public. | Build market-level and radius-level reads rather than a single national read. |
| What did it cost? | No public dollar value is disclosed. | Total fee, activation costs, production costs, and in-kind value are unknown. | Do not claim ROAS; use cost-normalized scenarios only if internal spend data exists. |
| What can be observed? | Howard athletics events, timing windows, restaurant locations, and market visitation patterns can be modeled. | Private app, POS, media exposure, and customer-level match data are not public. | Use OOH-style exposed-versus-control measurement with clear caveats. |
The New Jersey OOH Case Is a Proxy, Not a Howard Result
The closest useful benchmark in the available material is not another university sponsorship. It is an OUTFRONT case study for a McDonald's OOH campaign in New Jersey. In that campaign, OUTFRONT reported a visitation-rate lift of 135.45%, moving from 0.66% in the control group to 1.71% in the exposed group, and said exposed consumers were 120% more likely to visit than the control group.[3]
That is not evidence that the Howard sponsorship drove the same lift. It is not Howard-specific data, not a university athletics result, and not a substitute for the missing deal economics. Its value is methodological. It shows the kind of exposed-versus-control logic a buyer could bring to a local sponsorship instead of accepting awareness language as the only available outcome.
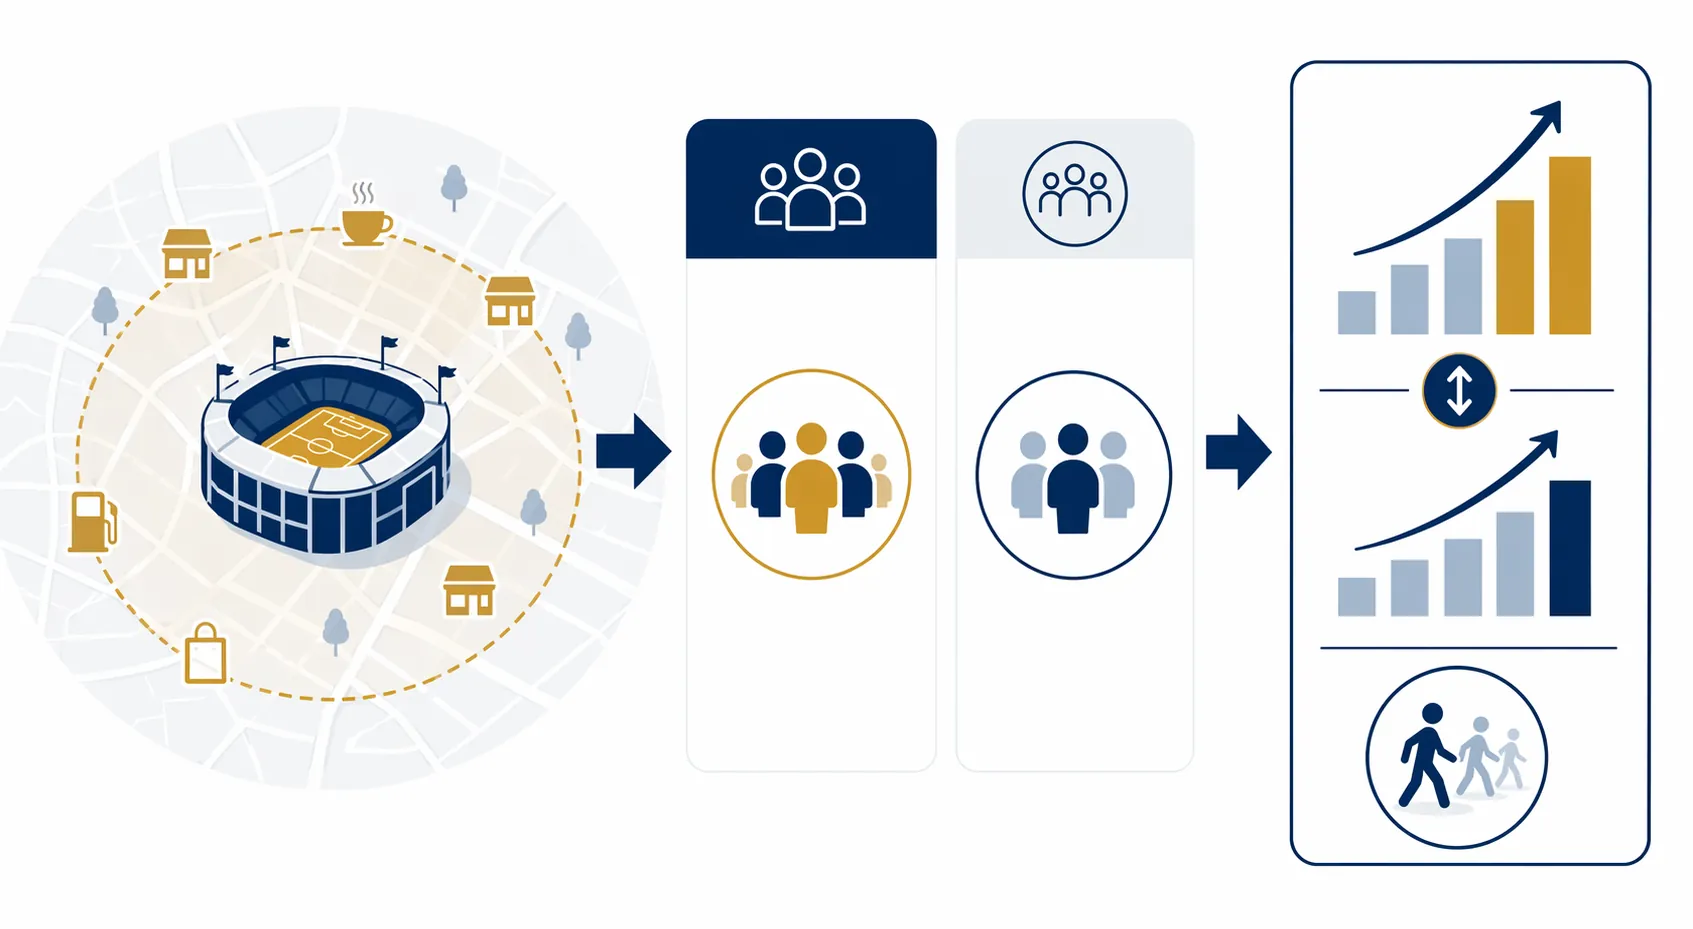
For Howard athletics, the equivalent model would start with places and moments: Greene Stadium, Burr Gymnasium, campus-adjacent areas, game days, pre-game and post-game windows, nearby restaurants, and comparable non-event windows. The buyer would not be measuring a click. The buyer would be testing whether people plausibly exposed to the sponsorship showed different restaurant-visit behavior than a similar group that was not exposed.
What an OOH-Style Read Could Measure
- Visit-rate lift: whether the exposed group visited restaurants in the defined footprint at a higher rate than the control group.
- Game-day behavior: whether nearby restaurants saw different visitation patterns before and after Howard athletics events.
- Radius effects: whether restaurants closer to campus or event venues behaved differently from restaurants farther away in the same broader market.
- Market comparison: whether the DC-Baltimore-Eastern Shore footprint moved differently from comparable McDonald's markets without the same sponsorship exposure.
- Repeat visitation: whether exposed devices returned to McDonald's locations again after the initial event window, if the measurement provider and privacy rules support that read.
None of those reads creates a clean CPA. They create an incrementality argument with a confidence level, a control design, and a list of exclusions. That is still a better standard than treating a local sponsorship as unmeasurable because it does not hand back a platform dashboard.
What You Cannot Calculate From the Public Deal
The public record does not support a Howard sponsorship ROAS number. There is no disclosed sponsorship fee, no activation budget, no media-equivalent valuation, no CPM, no cost per incremental visit, and no conversion value. Any precise ROAS claim made from the outside would be dressed-up guessing.
Even internal teams would need more than the rights fee. A fair cost base would include signage, hospitality, creative, local production, agency hours, promotional inventory, app offers, measurement vendor fees, and any restaurant-level discounting tied to the activation. The denominator is often where sponsorship analysis gets conveniently thin.
The revenue side is not automatic either. Store visits are not orders. Orders are not margin. A game-day visit might have happened anyway. A student who sees the brand at an athletics event may convert later through the app, a delivery marketplace, or a completely different store. The measurement plan has to decide which outcome is being credited before anyone starts dividing dollars by visits.
| Metric | Can it be calculated publicly? | Why |
|---|---|---|
| Total sponsorship ROAS | No | The public materials do not disclose spend or attributable revenue. |
| Cost per incremental visit | No, unless internal cost and visit-lift data are available | The methodology exists, but the required inputs are not public. |
| Directional visitation lift | Potentially, with a measurement partner | Mobile-location panels can compare exposed and control groups if the design is set up correctly. |
| Market-level sales movement | Internally, with caution | Restaurant sales can be compared across windows and markets, but many non-sponsorship variables affect sales. |
| Awareness or favorability | Potentially, through survey research | Survey results would measure attitudes, not necessarily restaurant behavior. |
The Franchisee Budget Context Is Directional, Not a Deal Estimate
Franchisee advertising structures are the reason this deal deserves more scrutiny than a normal partnership blurb. A 2015 Nation's Restaurant News article reported that McDonald's franchisees historically contributed about 1.6% of sales to the national OPNAD advertising fund.[4] That figure is dated, national-fund context. It should not be treated as the current contribution rate, and it should not be used as the source of the Howard partnership budget.
The useful takeaway is more basic: franchisee advertising money is not abstract corporate-purpose money. It is money operators expect to see work in their markets. The Howard deal sits in a local owner-operator structure, so the relevant governance question is whether the same operators who would ask hard questions about paid search, paid social, or delivery promotions also get a measurement read on the sponsorship.
That does not mean every franchisee-funded community partnership has to behave like a last-click campaign. It means the budget owner deserves a channel-specific measurement model. For a sponsorship, that model can include reach, attendance exposure, local press, content usage, campus relationship value, and restaurant visitation. It just needs to label each item correctly.
Digital Channels Get Forced Discipline; Sponsorships Often Escape It
A buyer running local-market Performance Max or Advantage+ does not get to stop at “community affinity.” The campaign is judged through spend, attributed conversions, store visits where available, creative rotation, budget pacing, match quality, audience signals, incrementality concerns, and the uncomfortable question of whether the platform is taking credit for demand that already existed.
Local sponsorships are often given a softer path. They can be approved on fit, announced on goodwill, and renewed on relationship momentum. That may be fine when everyone agrees the money is relationship spend. It becomes a problem when the same budget pool is being compared with channels that are expected to defend every dollar.
The fair comparison is not to demand that Howard athletics produce a platform-style ROAS dashboard. The fair comparison is to demand that the sponsorship enter the plan with the same seriousness: defined objective, measurement window, exposed population, control logic, store-footfall outcome, and a written statement of what will not be credited.
A Practical Measurement Plan
- Define the footprint: the 468-restaurant Capital Business Unit footprint is the broad market, but campus-adjacent and event-adjacent restaurants should be flagged separately.
- Separate event windows: compare game days, non-game days, pre-event windows, post-event windows, and comparable days from prior periods where data is available.
- Build exposed and control groups: use mobile-location methodology where privacy-compliant panels can distinguish likely exposure from similar non-exposure.
- Avoid one blended outcome: report visitation, sales, app engagement, offer redemption, and survey lift separately instead of rolling them into a single vague success score.
- Document exclusions: weather, team schedule, local promotions, delivery offers, store operations, and broader McDonald's media can all interfere with a clean read.
The point of that plan is not to make the sponsorship look more digital. It is to make the sponsorship accountable in its own channel language. A stadium sign, a campus partnership, and a local operator-funded activation can create value without producing a click path. They still leave enough observable surface area to test whether restaurant behavior changed around the exposure.
Purpose Context Belongs in the File, Just Not at the Center
The Howard partnership also sits near a broader McDonald's education and HBCU-facing portfolio. McDonald's has said its Black & Positively Golden scholarship program with the Thurgood Marshall College Fund grew from $500,000 for 34 recipients in 2020 to $1 million for more than 60 recipients in 2026.[5] McDonald's also describes Archways to Opportunity as having provided more than $100 million in tuition assistance to more than 55,000 restaurant employees.[6]
That context is relevant because it helps explain why an HBCU athletics partnership fits the brand's existing public commitments. It does not answer the local media question. Scholarship dollars, tuition assistance, and athletics sponsorship rights are different instruments. Grouping them together may help a corporate narrative; it does not tell a Capital Business Unit operator what the Howard athletics buy did for restaurants in the footprint.
The same caution applies to portfolio-level sponsorship benchmarks. SponsorPulse has reported McDonald's U.S. sponsorship portfolio metrics including 56% aided awareness, a 41% favorability increase, and a 36% purchase intent lift.[7] Those figures may be useful directional context for how McDonald's sponsorship assets perform across a broader portfolio. They are not Howard-specific performance data and should not be used as proof that this local deal generated the same results.
The Useful Answer Is Narrow
The Howard-McDonald's sponsorship can be measured, but not from the public announcement alone and not with digital-channel math pretending the missing inputs exist. The right frame is local OOH attribution: define exposure, isolate timing, compare against controls, watch store-footfall outcomes, and keep financial claims separate from behavioral signals unless the spend data is available.
That narrower answer is more useful than a confident invented ROAS number. The deal structure tells buyers where to look: 50 local owner-operators, 468 restaurants, a DC-Baltimore-Eastern Shore footprint, and undisclosed terms.[1][2] The measurement proxy tells buyers how to think: exposed versus control, visitation lift, and market-level comparison, with the New Jersey OOH result treated as a method example rather than a Howard outcome.[3]
The absence of public deal terms is not the end of the analysis. It is the reason the analysis matters. Local sponsorships should not have to become platform media to earn budget, but franchisee-funded local channels should be held to a measurement plan before everyone agrees that goodwill was enough.
References
- Howard Athletics Partners with McDonald's, Howard University Athletics, July 20, 2026
- Howard Athletics and McDonald's Announce Multi-Year Partnership, DataDrivenHBCU, July 22, 2026
- McDonald's, OUTFRONT
- How McDonald's franchisees help approve new marketing campaigns, Nation's Restaurant News, 2015
- McDonald's USA and Thurgood Marshall College Fund Expand Black & Positively Golden Scholarship Program, McDonald's
- Black & Positively Golden Education, McDonald's
- Decoding the Success Behind McDonald's Marketing, SponsorPulse
Built on this evidence
No Bidding tactic or Creative record currently cites this case file. Compare it against other results in Benchmarks.
Related benchmark reading
Report a corroborating or contradicting result
Seeing something different in your own account? Feed the data-integrity loop instead of leaving an open comment.