
What Fortnite John Wick Collaborations Cost vs. Paid Social
Compare Fortnite brand collaboration costs ($300K–$500K custom maps, $20K–$50K creator integrations) against your Meta, Google, and TikTok campaigns, and understand the measurement gap that prevents direct CPA or ROAS comparisons with traditional paid media.
- Platform
- Fortnite
- Campaign type
- Custom Map
- Spend range
- 0K-500K USD
- Timeframe
- 0
- Engagement
- 0M engagements
- Verdict
- mixed
- Industry vertical
- Gaming
- Last reviewed
- 0-07-30
A Fortnite custom map sits in an awkward budget slot: too expensive to treat as an experimental content post, but too unlike paid social or search to judge with the same dashboard. The quoted range for a custom Fortnite activation is $300,000 to $500,000, while an integration into an existing creator island is quoted at $20,000 to $50,000, roughly a 10x to 25x price gap depending on the package.[1] That puts the custom-map conversation near the kind of mid-size paid media test a growth team might already defend in Meta, TikTok, YouTube, or Performance Max.
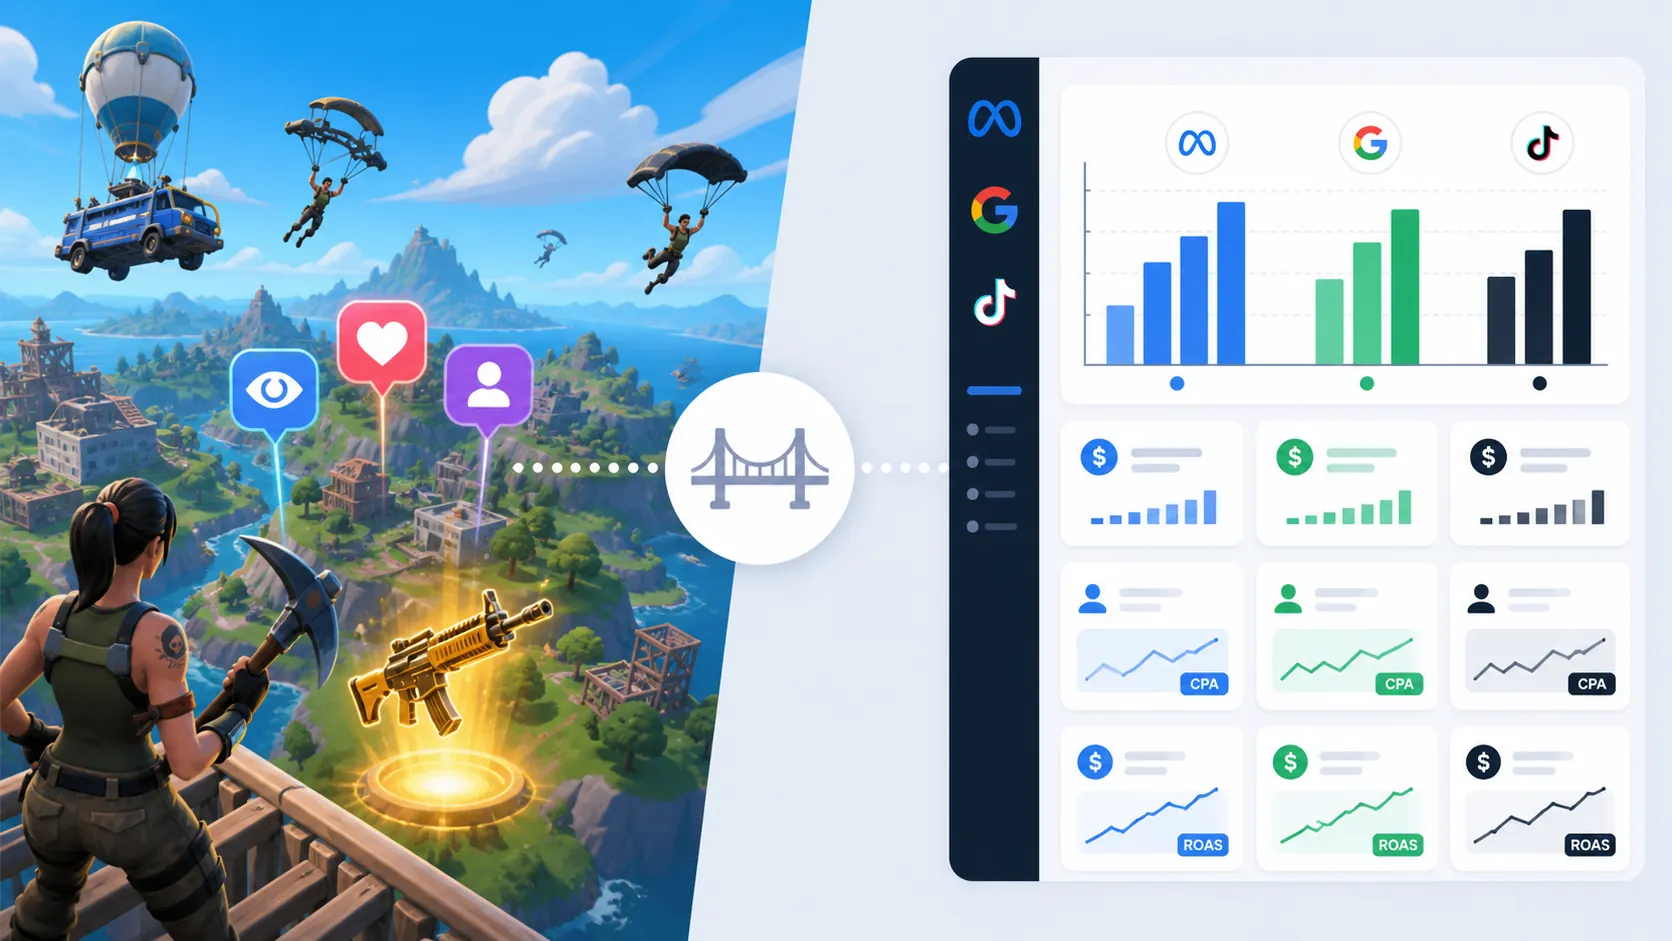
The problem is that the reporting does not come back in the same language. Paid media buyers are used to CPM, CPC, CPA, MER, ROAS, incrementality tests, and platform-attributed revenue. Fortnite campaigns tend to report participation, concurrent players, content views, coupon redemptions, brand lift, and sometimes vendor-reported sales lift. Those can be useful signals. They are not audited cost-per-purchase metrics.
One clarification matters before getting into the numbers: the “Sprite” in the Fortnite John Wick Sprite conversation is not a published Coca-Cola Sprite beverage campaign. It refers to a datamined Fortnite Sprite collectible tied to John Wick speculation. The reported item is unreleased, listed as Mythic rarity, and described as a gameplay object rather than a normal cosmetic skin.[4] It is a signal about where brand collaborations may be headed, not proof that a John Wick Sprite brand advertising campaign has delivered measurable ROI.
The Spend Comparison Buyers Actually Need
| Budget choice | Typical reported cost or frame | What the buyer is really buying | Measurement comfort level |
|---|---|---|---|
| Custom Fortnite map | $300K-$500K per activation | A branded destination inside Fortnite, usually with bespoke design, mechanics, and launch support | Low if the finance team expects CPA or ROAS |
| Creator island integration | $20K-$50K per integration | Placement inside an existing island that already has player traffic or creator distribution | Moderate if success is defined around participation, views, or redemption |
| Meta, TikTok, Google, or Performance Max test | Flexible budget, usually optimized through auction-based delivery; 2026 Meta CPM benchmarks around $11.20-$17.70 | Targeted reach, clicks, conversions, and platform-attributed sales | High if existing benchmarks already define acceptable CPA or ROAS |
The cleanest way to evaluate Fortnite is not to ask whether $300,000 buys “more” than paid social. It buys a different asset. A custom map buys ownership of a destination. A creator integration buys access to attention that is already moving through someone else’s destination. Paid social buys auctioned distribution with reporting built around delivery and conversion events.
That distinction is where many pitches get too smooth. “Ten million engagements” can be a strong participation number, but it does not answer the same question as “What did we pay per incremental customer?” A CFO who understands a 2026 Meta CPM baseline around $11.20 to $17.70 will not automatically accept a six-figure Fortnite spend because the audience is large. The bridge has to be built metric by metric.
Why Fortnite Keeps Getting Into the Budget Room
The interest is not mysterious. Fortnite reportedly reached 144 million daily active users in 2026, with Gen Z representing 73% of the audience and users logging more than 10 hours weekly.[2] Digiday also reported that brand activations in Fortnite grew from 136 in 2023 to 270 in 2024, citing GEEIQ data, a 99% year-over-year increase.[1]
Those numbers explain why brands are taking meetings. They do not decide whether a campaign should be funded. Scale tells a buyer that the environment is worth studying. It does not prove that a custom island will attract traffic, that the audience will remember the brand, or that a measurable business action will follow.
The stronger argument for Fortnite is not simply that young players are there. It is that the brand can become part of play. A player can visit a branded restaurant, pick up an item, complete a challenge, watch a streamer use a mechanic, or redeem something outside the game. That is more interesting than another vertical video impression. It is also harder to measure cleanly.
Custom Map or Creator Island Is the First Real Decision
The custom-map option is the version most non-gaming executives picture first: a branded world, built around the campaign, launched as a destination. It looks ownable. It photographs well. It gives the brand a thing to point at.
It also carries the most obvious distribution risk. Digiday quoted REVXP and Chipotle executive Chris Mann saying that major brands have peaked at “sub-200, sub-100, sometimes sub-50 peak player counts” on custom maps.[1] That is the line in the deck that changes the conversation. A beautiful island with 80 concurrent players is not a media plan; it is a destination waiting for media.
Creator islands start from a different premise. They already have behavior. They may already have repeat visitors, live operations knowledge, streamer relationships, and an understanding of what keeps players in-session. Epic said creator-built islands captured 47% of all Fortnite player hours in May 2026.[1] If the audience is already spending nearly half its Fortnite time in creator-made environments, paying to enter one of those environments can be a more practical distribution strategy than asking players to discover a new branded map from scratch.
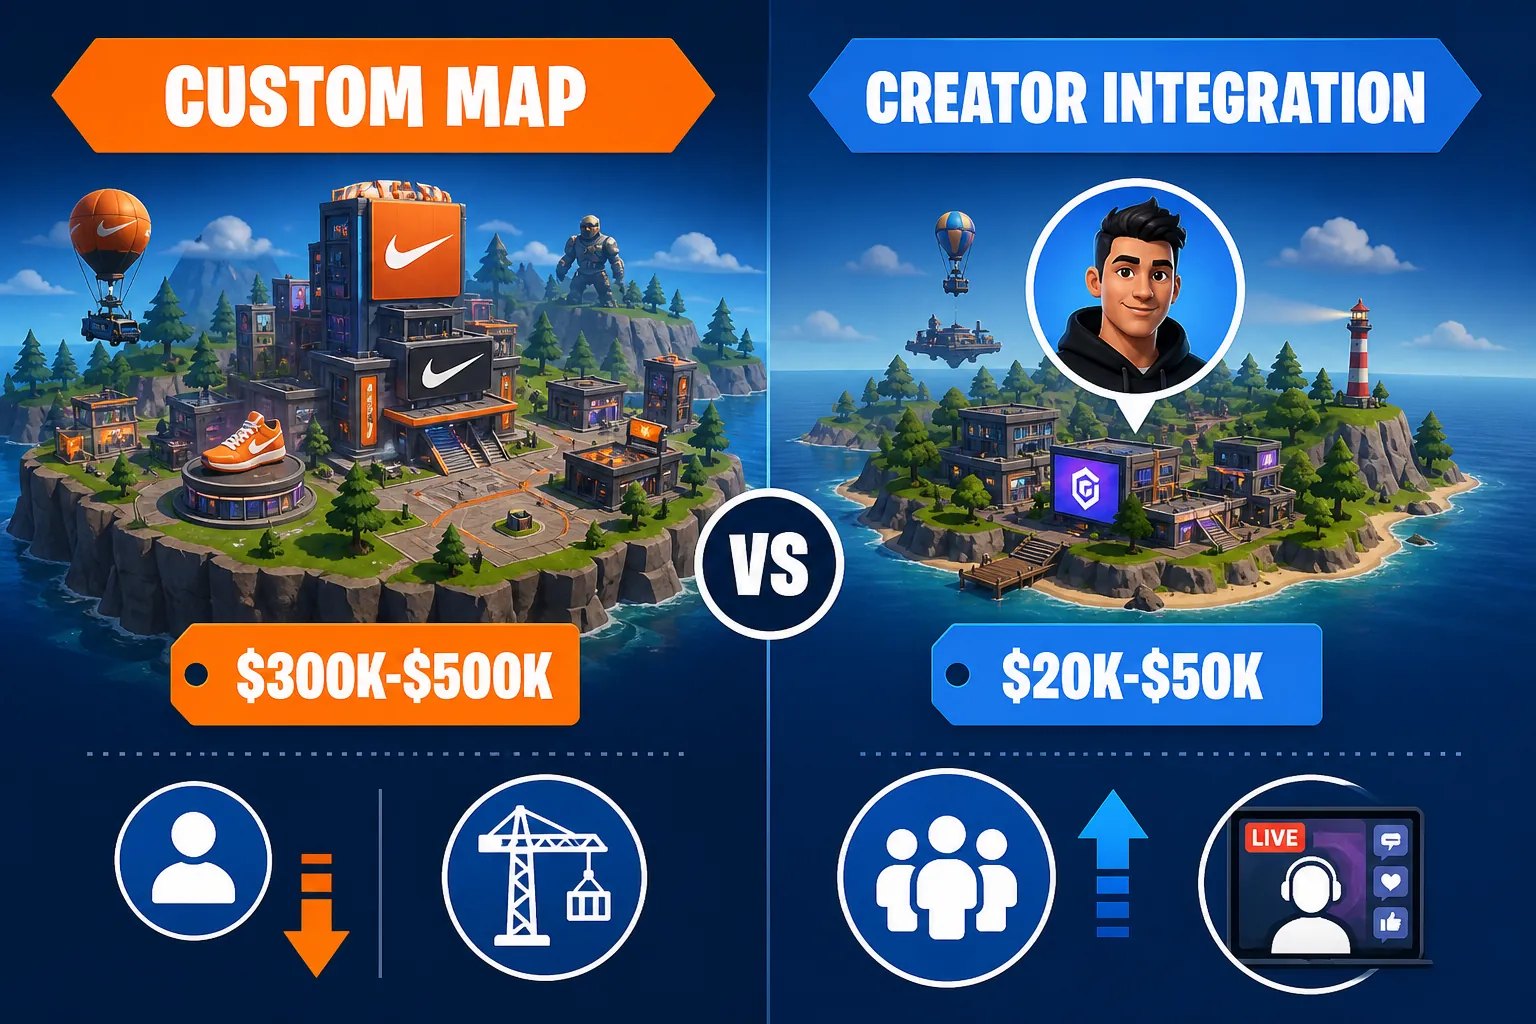
The price gap reflects that difference. A $20,000 to $50,000 creator integration does not give the same control as a $300,000 to $500,000 custom build.[1] The brand may have less ownership over the environment, less room for custom mechanics, and less ability to treat the activation as a campaign centerpiece. But for a performance-minded buyer, less control may be an acceptable trade if the integration starts closer to existing attention.
What Published Fortnite Results Can and Cannot Tell You
The most useful published results are the ones that keep their original shape. Engagement is not revenue. Views are not store visits. Coupon redemptions are not total incremental sales. Brand lift is not ROAS. The mistake is not using these metrics; the mistake is pretending they answer questions they were not designed to answer.
| Reported metric | What it can answer | What it cannot answer |
|---|---|---|
| Engagements | Whether players interacted with the activation | Whether the interaction caused a purchase |
| Unique visitors | How many players entered or experienced the activation | Whether they were incremental to other media exposure |
| Concurrent players | Whether the map had live in-island traffic at a given time | Whether off-platform content extended reach |
| Total views | Whether creator or streamer distribution spread the campaign | Whether viewers became customers |
| Coupon redemptions | Whether some players took a measurable action outside the game | Full-funnel ROAS without cost, margin, and incrementality |
| Brand lift | Whether exposed or recalling audiences report stronger attitudes or intent | Audited revenue contribution |
Popeyes is one of the more useful cases because it includes more than a vanity number. AnyRoad reported more than 10 million engagements and a 3x sales lift from a single map integration, while Digiday reported Good Gamers figures of 721,000 unique visitors and 892 coupon redemptions.[2][1] The coupon number matters because it moves closer to behavior than attention alone. The sales-lift claim should still be labeled as vendor-reported, not treated as an independently audited benchmark.
A buyer can do something with 892 coupon redemptions. They can ask what the integration cost, whether the coupon was unique to Fortnite, whether redemptions were net-new or subsidized existing demand, what the average order value was, what margin remained after discounting, and whether the campaign changed behavior in markets where the media ran. That is a better conversation than dividing spend by engagements and calling it performance.
The General’s “Road Test Royale” shows the other side of the measurement problem. The custom map reportedly had low concurrent players but generated more than 50 million total views through Twitch streamer partnerships, according to Look North World’s CEO as reported by Digiday.[1] That can still be a successful awareness play. It just complicates the story if the campaign was sold internally as a map build rather than a streamer-distributed content campaign with a playable asset attached.
For a budget owner, that distinction affects which line item gets credit. If most reach comes through streamers, the map is not necessarily the media channel. It may be the creative object that gives streamers something worth showing. That is not a downgrade. It is a different buying logic.
Brand Lift Helps, but It Does Not Close the ROAS Gap
Brand-lift research can strengthen the case for in-game advertising, especially when the objective is favorability or purchase intent rather than immediate checkout. YouGov’s in-game brand activation guide, using Roblox as the measured platform, reported that players who recalled a brand in-game were 28% more likely to feel favorably toward it and 63% more likely to buy.[3] That is useful adjacent evidence, with an important platform caveat: Roblox findings should not be treated as Fortnite campaign benchmarks.
The more honest use of brand lift is to define a persuasion objective upfront. If the goal is to increase favorability among Gen Z players, measure recall, favorability, and intent with an exposed-control design where possible. If the goal is store visits or sales, add a redemption layer, unique codes, geo tests, or holdout markets. If the only acceptable outcome is platform-attributed ROAS, Fortnite will look frustrating before the campaign even launches.
The John Wick Sprite Points to a Different Collaboration Model
The unreleased John Wick Sprite is interesting because it suggests a collaboration model beyond the familiar branded skin or standalone map. The Fortnite Sprites listing describes a datamined Mythic-rarity collectible with the internal ID “wick_basic,” framed around powers and how players may obtain it if released.[4] Because the item is not live, it cannot tell buyers what a campaign cost, how many players used it, or whether it drove sales.
Still, it changes the planning question. A playable item with combat function is different from a logo on an island or an avatar outfit. If branded gameplay objects become more common, the media decision may shift from “Should we build a Fortnite map?” to “Should we fund a mechanic, creator distribution, a custom destination, or some combination of the three?”
That is where the John Wick Sprite belongs in a budget discussion: as a forward-looking signal, not a case study with current economics.
How to Defend or Reject the Spend
A Fortnite activation becomes easier to defend when the objective is written in the channel’s native terms and then connected, carefully, to business behavior. The budget case should not say “Fortnite will beat Meta on CPA” unless the brand has a test design that can actually prove that. A stronger case says the campaign will buy Gen Z participation, creator-distributed attention, brand favorability, or a measurable redemption layer that paid social cannot create in the same way.
- Use a custom map when the brand needs an ownable destination, has enough launch media to avoid empty-island risk, and can accept engagement, lift, or redemption as the primary proof.
- Use a creator integration when the brand values existing player traffic and streamer distribution more than full environmental control.
- Require unique codes, coupon paths, or other redemption mechanics if the business needs evidence beyond awareness and participation.
- Keep paid social or search as the benchmark when the only acceptable success metric is CPA, ROAS, or conversion volume comparable to existing auction channels.
- Treat vendor-reported lifts and views as useful inputs, not as substitutes for incrementality, margin, or audited revenue.
The clean budget answer is not that Fortnite is too expensive or that paid social is too boring. A $300,000 to $500,000 custom map can be reasonable if the brand is buying participation, cultural presence, and a testable action layer. A $20,000 to $50,000 creator integration can be a more efficient first step if distribution matters more than ownership. Neither should be approved if the deck quietly turns engagements, views, or brand lift into CPA and ROAS without showing the bridge.
References
- Advertisers are split on how to show up inside Fortnite, Digiday, September 2025
- Fortnite Brand Activation Examples That Resonate With Gen Z, AnyRoad, March 2026
- How to measure in-game brand activations, YouGov
- John Wick Sprite in Fortnite — Release Date, Powers & How to Get It, Fortnite Sprites
Built on this evidence
No Bidding tactic or Creative record currently cites this case file. Compare it against other results in Benchmarks.
Related benchmark reading
Report a corroborating or contradicting result
Seeing something different in your own account? Feed the data-integrity loop instead of leaving an open comment.