
Why the 2025 Fed Rate Cuts Didn't Lower Mortgage Ad Costs
Performance marketers expected the Q4 2025 Fed rate cuts to improve mortgage ad economics, but CPC and CPL remained elevated. This article uses real campaign benchmarks to explain why widened Treasury–mortgage spreads, auction competition, and the rate lock-in effect compressed the window for paid-media buyers.
- Platform
- Google Ads0 Meta
- Campaign type
- Search0 Social
- Spend range
- Varies
- Timeframe
- Q0 2025
- CPL
- $0–$70
- Verdict
- loss
- Industry vertical
- Mortgage
- Last reviewed
- 0-07-30
The awkward Q4 2025 account review starts here: the Fed cut three times, mortgage shoppers did pay more attention, and yet the paid-media economics many lenders expected did not broadly reset. The federal funds rate moved down through three 25-bp cuts in September, October, and December, ending the cycle at 3.50%–3.75%.[1] But mortgage advertisers still had to buy clicks, answer leads fast, and fund loans through a market where consumer motivation was thinner than the Fed headline made it look.
| Metric or condition | Benchmark to compare against | Source caveat |
|---|---|---|
| Fed rate path | Three 25-bp cuts in Q4 2025; federal funds rate at 3.50%–3.75% after December.[1] | Macro timeline, not a mortgage-rate guarantee. |
| Google Ads mortgage CPL | $30–$70 for well-optimized campaigns; generic terms at $75–$150+.[2] | LeadPops is a mortgage marketing platform analyzing its own campaign and lead data. |
| Paid-ad CPFL | $1,200–$4,500+ industry average; optimized funnels could reach about $1,500 CPFL in LeadPops’ analysis.[3] | Vendor-origin benchmark, useful for comparison but not a neutral market audit. |
| Treasury–mortgage spread | Roughly 3 percentage points after cuts versus a historical 1.5–2 percentage point range.[4][5][6] | Explains why mortgage rates stayed above 6% despite Fed easing. |
| Borrower lock-in baseline | About 60% of 50.8 million active mortgages had sub-4% rates as of September 2024.[6] | Pre-2025 baseline, not a measured Q4 2025 campaign outcome. |
| Meta mortgage lead context | $4–$30 CPL with 1%–4% conversion rates; real-estate Facebook CPC swung from $1.22 in July 2025 to $0.36 by July 2026.[7] | Superads uses a $3B aggregated ad-spend dataset that may skew toward larger advertisers. |
That is the core problem with turning Fed rate cuts into a 2025 mortgage ad strategy. The cuts created a demand window. They did not automatically create cheaper funded loans. A lender could see more form fills, more call volume, and more refinance curiosity while still watching cost per funded loan stay stubborn because each step between “consumer noticed rates” and “loan funded” absorbed some of the benefit.

The Fed Cut, But Mortgage Rates Did Not Follow Cleanly
The clean executive-slide version says lower Fed rates should make mortgage demand easier to capture. The campaign version has more friction. Mortgage rates respond to longer-term rate expectations, bond-market pricing, investor risk appetite, and servicing economics; they do not simply shadow the federal funds rate. In Q4 2025, that distinction mattered because the spread between Treasury yields and mortgage rates widened to roughly 3 percentage points, compared with a more normal historical range of about 1.5 to 2 percentage points.[4][5][6]
That spread is not an academic footnote for a media buyer. It is the difference between a borrower seeing a headline about Fed cuts and that same borrower seeing an actual mortgage quote that still begins with a 6. When the borrower’s personal math does not improve enough, the campaign gets the worst version of demand: more curiosity than commitment.
This is where many Q4 plans were too generous. They modeled rate-cut attention as if it would behave like rate-cut savings. Search volume and click intent can rise before the borrower has a compelling refinance reason. Purchase borrowers may re-enter comparison mode, but affordability remains tight if payment relief is marginal. The marketing team can buy that attention; it cannot force the spread to normalize.
Lock-In Capped the Refinance Pool Before the Campaigns Even Launched
The lock-in problem was already sitting inside the file before Q4 budgets moved. CFPB data showed that, as of September 2024, about 60% of 50.8 million active U.S. mortgages had rates below 4%.[6] That is the starting condition advertisers carried into 2025: a huge share of homeowners had to be offered something meaningfully better than “rates are a little less bad” before refinancing made economic sense.
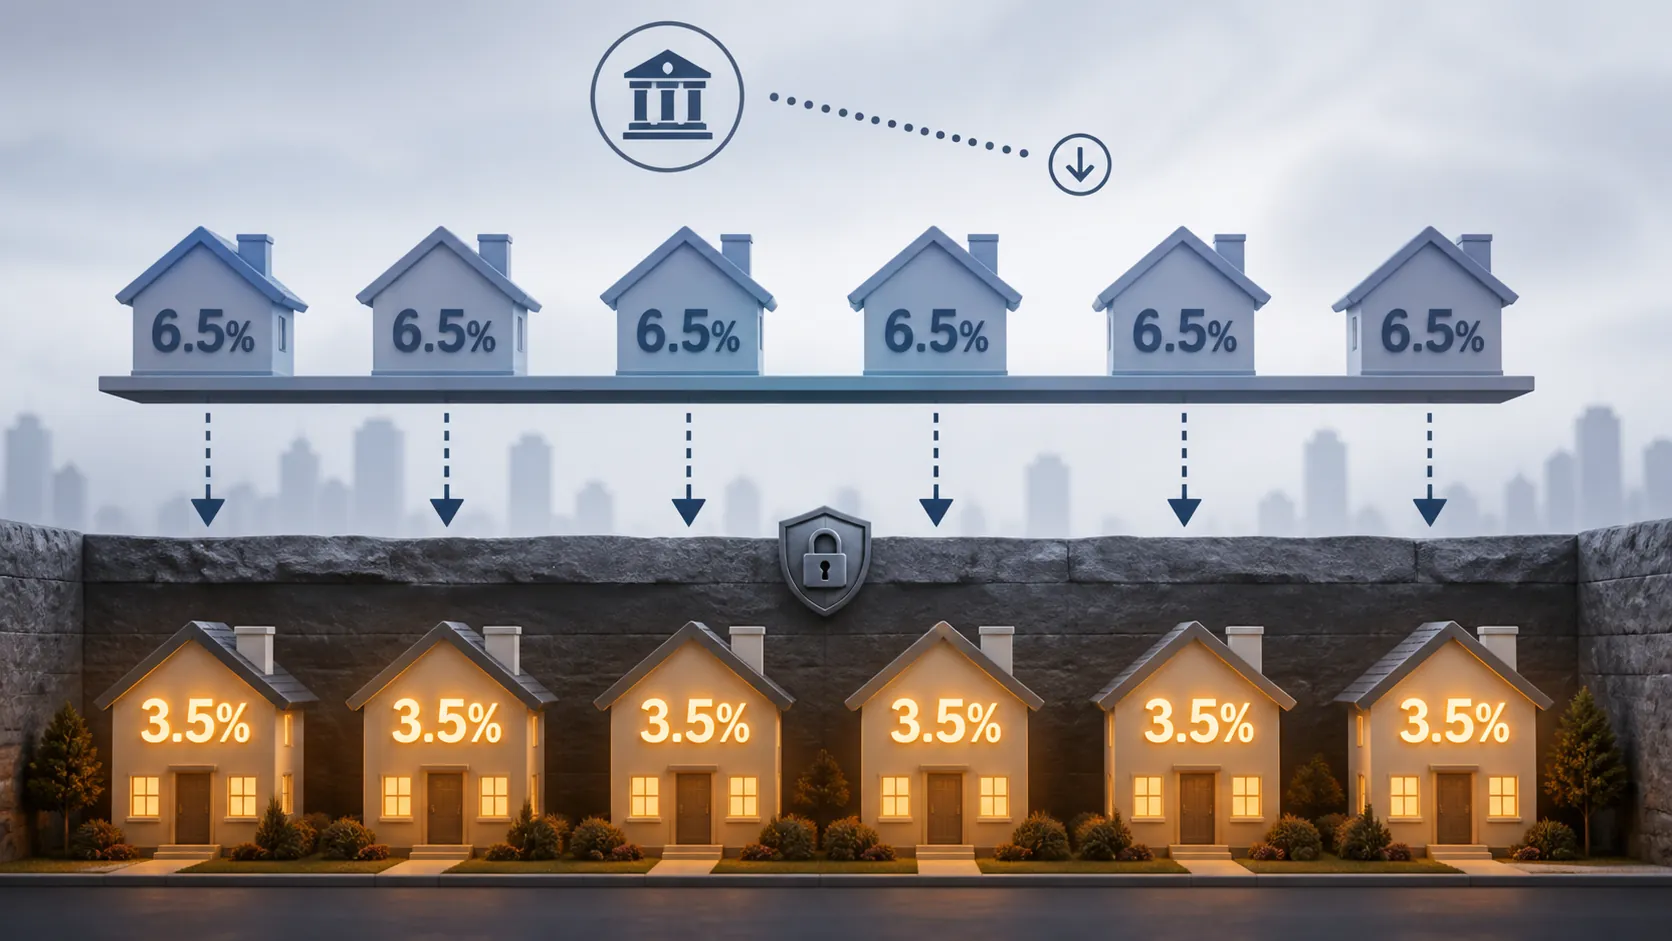
That baseline narrows the practical audience. Some homeowners still had reasons to act: cash-out needs, debt consolidation, divorce, relocation, term changes, or an adjustable-rate concern. But the broad “Fed cuts equal refi boom” assumption required a larger population of borrowers who could improve their payment enough to move. With so many existing loans below 4%, the incentive threshold remained high.
The consequence shows up downstream. A campaign can produce a lead at a tolerable CPL and still fail CPFL if the borrower is rate-shopping, not ready, not eligible, or not economically motivated after seeing a real quote. That is why CPL alone is a dangerous scoreboard during a rate-cut window. It measures captured interest. It does not measure whether the borrower’s existing mortgage gives them permission to transact.
The Auction Got Crowded at the Same Moment Everyone Wanted Efficiency
Once the September cut arrived, mortgage advertisers did what they were supposed to do: they moved. Budgets shifted toward refinance terms, purchase-intent segments, rate-update creative, and lead forms that could be turned around quickly. The problem is that auctions do not reward the industry for collectively having the same idea.
If three lenders raise bids on the same “mortgage refinance rates” query set, the borrower does not become three times more likely to fund. The click just becomes more expensive, or the same CPC buys lower-quality marginal traffic. In that environment, the lender with the biggest budget is not automatically the winner. The winner is often the lender with the least leakage after the click.
LeadPops’ Google Ads benchmark puts well-optimized mortgage campaigns at $30–$70 CPL, while generic terms can run $75–$150+.[2] Those ranges are useful, but they should be treated as vendor-origin benchmarks, not a market tape. LeadPops is analyzing its own mortgage marketing data. That does not make the data useless; it means the right use is comparison, not blind acceptance.
The bigger problem is that a $50 lead can be cheap or expensive depending on what happens next. If the call team reaches the borrower while they are still on the page, if the form asked the right loan-type questions, and if the offer matches the borrower’s reason for shopping, the lead has a path to becoming a file. If the same lead waits in a queue, receives a generic follow-up, or lands on a page built for every mortgage product at once, the campaign can hit its CPL goal and still miss funded-loan economics.
Where CPC Relief Was Still Available
Some advertisers did have room to reduce CPC through better account quality: tighter ad groups, stronger message match, cleaner landing pages, and higher expected click-through performance. A mortgage search account sitting on weak Quality Scores can waste money even in a favorable market.
But platform hygiene is not the same thing as borrower economics. Quality improvements can lower the price of admission. They do not change the fact that a locked-in homeowner may not refinance, or that a widened spread can keep quoted mortgage rates above the borrower’s action threshold.
Meta Looked Cheaper, But It Was Mostly a Different Job
Meta benchmarks can make the search auction look irrational at first glance. Superads reports mortgage CPL at $4–$30 with 1%–4% conversion rates, and its real-estate Facebook CPC data shows a swing from $1.22 in July 2025 to $0.36 by July 2026, with real-estate CPC volatility running three times the cross-industry baseline in its dataset.[7]
That volatility is worth noting because it captures how unstable housing-related paid traffic became across the period. The caveat is just as important: Superads is working from a $3B aggregated ad-spend dataset, which may over-represent larger advertisers active on its platform.[7] The pattern is useful; the exact dollar figures may not match a local credit union, regional IMB, or brokerage running a smaller account.
Meta’s role in this window was usually top-of-funnel. It could generate cheaper hand-raisers, educate borrowers, and feed retargeting pools. But a low Meta CPL did not erase the need for qualification, nurture, and fast follow-up. A borrower who taps a refinance ad in a feed is not the same as a borrower typing a specific rate query into Google. The CPFL comparison only becomes fair after the full path is measured.
CPFL Is Where the Q4 Story Got Honest
LeadPops places paid-ad cost per funded loan at an industry average of $1,200–$4,500+, with optimized funnels reaching roughly $1,500 CPFL when website conversion rates improve from under 1% to 5%–12% through multi-step forms, instant follow-up, and loan-type-specific landing pages.[3] Again, this is vendor-origin data. Still, it frames the right question: not whether a campaign bought leads, but whether it bought fundable demand at a cost the lending team could defend.
The funnel math explains why two advertisers could experience the same rate-cut window differently. Suppose two lenders both pay for the same refinance traffic. One sends every visitor to a generic mortgage page, waits to follow up, and routes leads by manual review. The other separates cash-out, rate-and-term, purchase, FHA, VA, and conventional intent; calls immediately; and tracks funded-loan outcomes by source and keyword cluster. The second lender does not need a different Fed. It needs fewer wasted steps.
This is also why Q4 2025 punished blended reporting. If refinance leads, purchase leads, home-equity inquiries, and low-intent rate shoppers all sit in one dashboard row, the account can look busy while the funded-loan mix deteriorates. A cheaper lead source can dilute performance if it adds borrowers who do not fit current product economics. A more expensive search campaign can be defensible if it produces higher pull-through.
| What moved | What it did to the funnel | What to benchmark |
|---|---|---|
| Fed cuts | Created more borrower attention and internal pressure to spend. | Spend changes by week around September, October, and December cuts. |
| Mortgage rates stayed above 6% | Reduced the number of borrowers with obvious payment motivation. | Lead-to-application rate by quoted-rate band. |
| Sub-4% borrower lock-in | Suppressed broad refinance willingness. | Refi lead disposition reasons, especially “current rate too low.” |
| Auction crowding | Raised competition for the same intent signals. | CPC, impression share, top-of-page rate, and marginal CPL. |
| Funnel quality | Determined whether interest became funded loans. | Speed-to-lead, page conversion rate, application rate, and CPFL by loan type. |
What a Fair Post-Mortem Should Say
A fair Q4 2025 post-mortem should not excuse sloppy campaigns. If the account used broad generic terms, weak landing pages, slow lead response, and no funded-loan feedback loop, the rate-cut window probably exposed those problems. The market gave those advertisers more chances to waste money.
It also should not pretend every stubborn CPL or flat CPFL was a media-buying failure. The conditions were structurally tight. Mortgage rates did not fall in a straight line with the Fed. A large share of homeowners entered the year locked into rates below 4%. Lenders crowded the same auctions. The borrower who was curious after a Fed announcement often still needed a much better quote, a specific financial trigger, or a purchase deadline before becoming a funded loan.
The advertisers who benefited most were fast and well-instrumented. They separated loan types before the landing page tried to convert everyone. They measured source quality beyond CPL. They treated speed-to-lead as part of media performance, not as a sales-ops footnote. They watched CPFL by campaign and borrower intent instead of averaging away the difference between cheap curiosity and fundable demand.
So the benchmarkable conclusion is narrower than the Q4 optimism was: if your Google Ads CPL sat above the $30–$70 optimized range, if generic terms ran into the $75–$150+ zone, or if CPFL failed to move meaningfully below the $1,200–$4,500+ band, that does not automatically prove the campaign failed.[2][3] It may mean your account was buying into the predictable compression created by widened spreads, locked-in borrowers, and crowded auctions. The useful next step is to compare your numbers against those ranges with the caveats attached, then isolate where the economics broke: CPC, lead quality, speed-to-lead, application pull-through, or funded-loan conversion.
References
- Federal Funds Rate History 1990 to 2026, Forbes Advisor
- Google Ads for Mortgage Brokers: What Works in 2026 ($30–$70 CPL), LeadPops
- Mortgage Lead Generation in 2026: The Complete Playbook (3.2M Leads Analyzed), LeadPops
- How The Fed's Rate Decisions Move Mortgage Rates, Bankrate
- How Fed Rate Cuts Can Impact Mortgage Interest Rates, Charles Schwab
- Data Spotlight: The Impact of Changing Mortgage Interest Rates, Consumer Financial Protection Bureau
- Facebook Ads CPC Benchmarks for Real Estate (2025), Superads
Built on this evidence
No Bidding tactic or Creative record currently cites this case file. Compare it against other results in Benchmarks.
Related benchmark reading
Report a corroborating or contradicting result
Seeing something different in your own account? Feed the data-integrity loop instead of leaving an open comment.