
Test In-Car Ads Before Tesla Self-Driving AI Opens
The in-car advertising market is projected to reach $6.7 billion by 2034, and testable inventory already exists in Uber Journey Ads and aftermarket tablets. This article breaks down current CPM benchmarks, key players, and what Tesla's 6.8 million connected vehicles mean for future programmatic access.
- Platform
- Uber Advertising
- Campaign type
- Journey Ads
- Spend range
- Small test budget
- Timeframe
- 0-2026
- CTR
- 0%-4.6%
- Verdict
- mixed
- Last reviewed
- 0-07-29
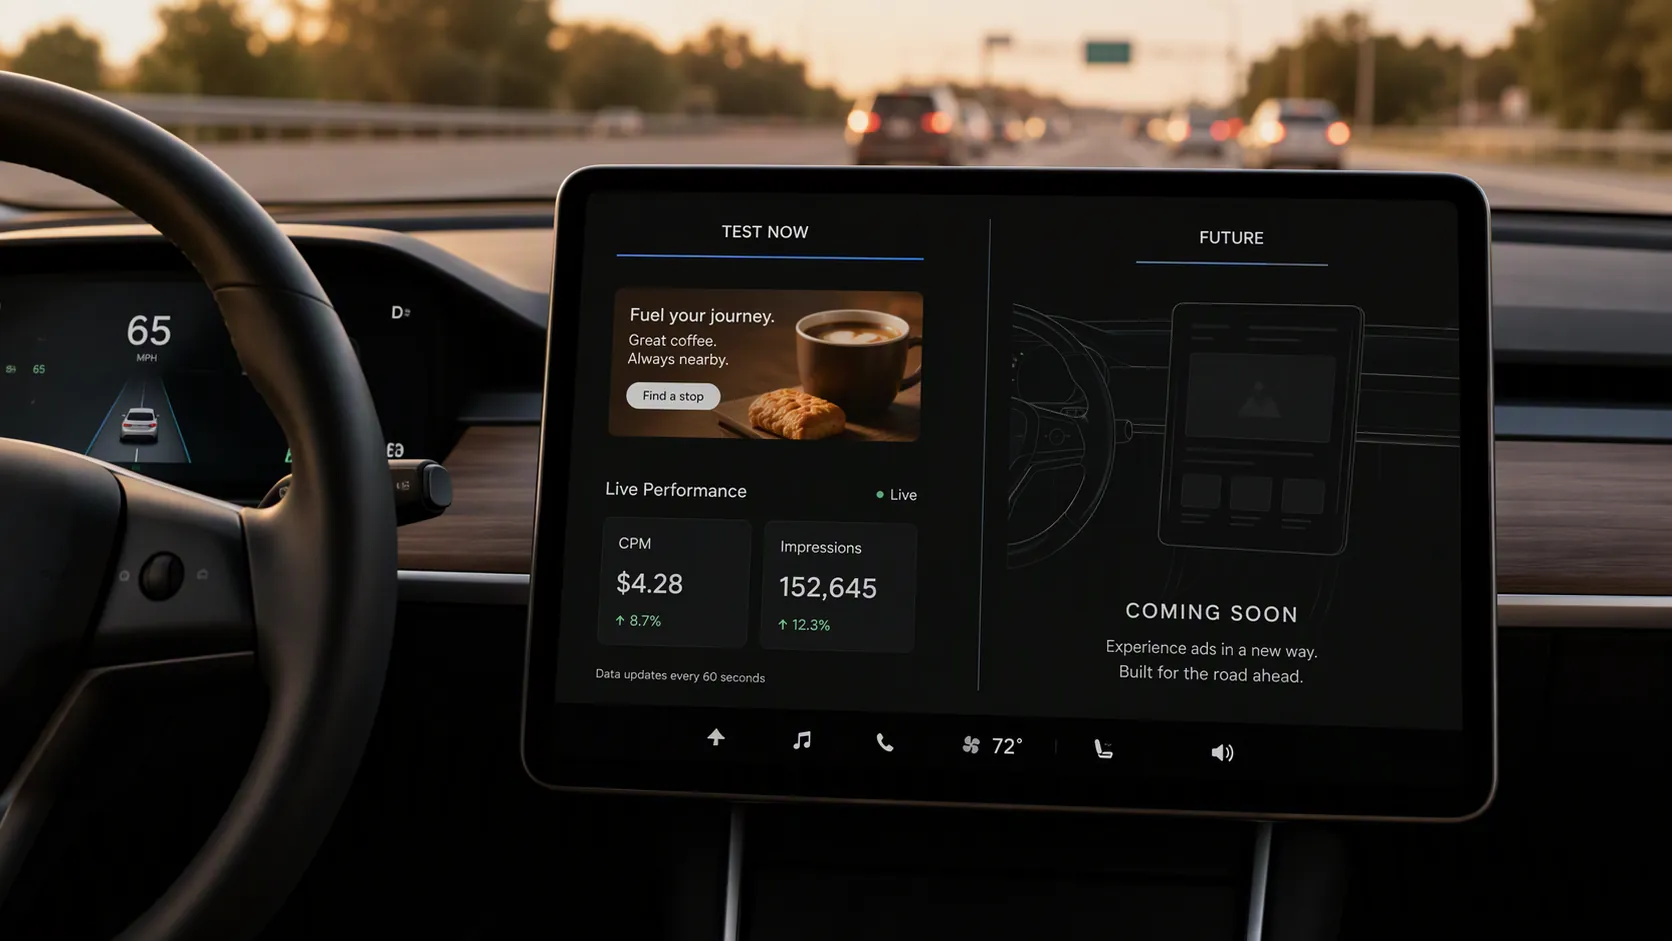
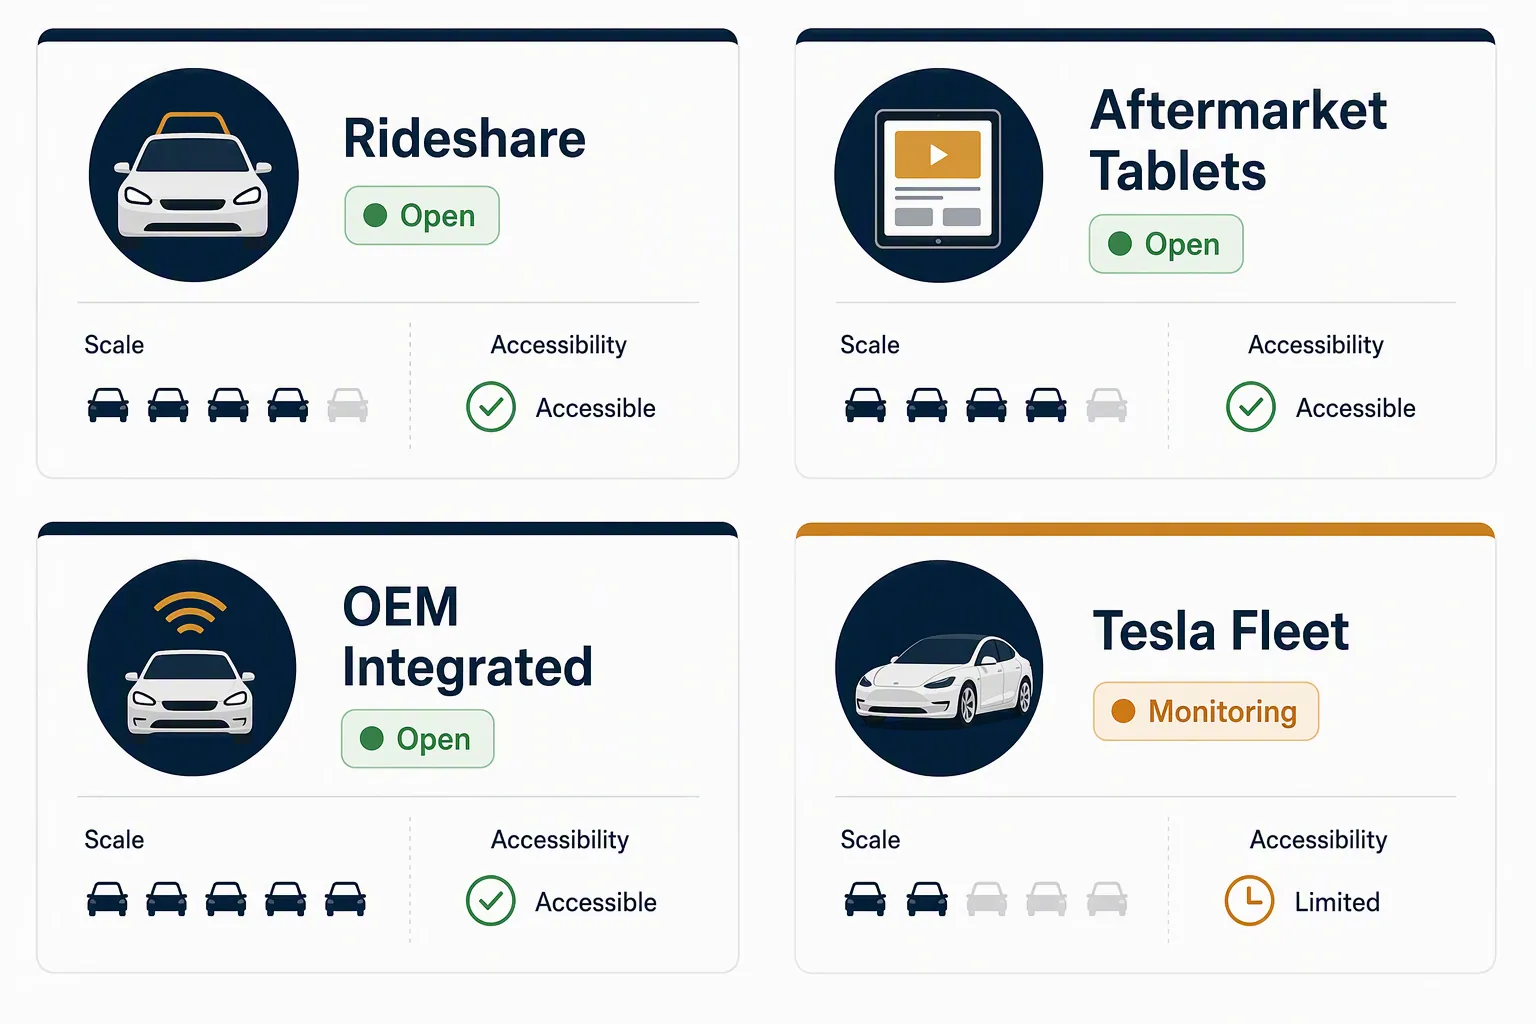
The buying problem is simpler than the Tesla self-driving AI pitch makes it sound: Tesla is not an open programmatic ad marketplace today. A media buyer cannot log into a DSP this quarter, select Tesla infotainment inventory, set a bid, and compare delivery against mobile display or digital out-of-home. What can be bought today sits next to that future: rideshare app placements, aftermarket passenger tablets, and OEM-integrated connected-car inventory.
That does not make the category imaginary. Dataintelo reports the in-car advertising platform market at $1.8 billion in 2025, projected to reach $6.7 billion by 2034 at a 15.8% CAGR, with North America representing 38.4% share, or about $691 million in 2025.[1] Uber has already turned mobility media into a $2 billion-plus annualized advertising business with more than 50% year-over-year growth.[2] Tesla, meanwhile, has the cleaner future-inventory story: more than 6.8 million connected vehicles globally and about 1.5 million FSD subscribers as of Q2 2026.[3]
Those are three different facts, not one channel. Treating them as interchangeable is how test budgets get misbriefed.
What Can Actually Be Bought
The useful split is access first, measurement second, imagination last. If inventory is not available through a named sales path, it belongs on a watchlist, not in a Q3 media plan.
| Inventory source | Can a buyer test it now? | Scale signal | CPM or performance benchmark | Main caveat |
|---|---|---|---|---|
| Uber Journey Ads | Yes, through Uber Advertising | $2B+ annualized ad run rate; 50%+ YoY growth | 6.6x industry-average attentive seconds and 27% lift in brand consideration in Uber/Lumen study | The attention study measures in-app mobile Journey Ads during rides, not a native Tesla or robotaxi screen experience.[2] |
| Octopus Interactive and Vugo | Yes, via aftermarket rideshare tablet inventory | 55K-65K active vehicle deployments combined in Q1 2026 | $8.50-$22 CPMs | Smaller pools; useful for controlled tests, not broad reach plans.[1] |
| Telenav and OEM-integrated platforms | Yes, where programmatic access is enabled | 7.2M active vehicles | $10-$22 connected in-car CPM range reported for the category | Largest open programmatic pool in the materials, but OEM inventory standards and measurement are not the same as rideshare app media.[1] |
| Tesla fleet | No open programmatic buy path | 6.8M+ connected vehicles globally; about 1.5M FSD subscribers | No public Tesla CPM benchmark | Fleet scale is real, but ad access is not. Current projections are inferences from infrastructure and OEM trends.[3] |
Uber is the strongest current proxy because it has both demand and repeatable buying infrastructure. It is not proof that a Tesla screen would perform the same way. The ad is served in Uber’s app during a trip, which means the device, interaction pattern, and measurement surface are still mobile-adjacent. For a buyer, that distinction matters less because it weakens Uber and more because it prevents the wrong benchmark from being pasted into a Tesla forecast.
Aftermarket tablets sit on the other side of the tradeoff. Octopus Interactive and Vugo offer inventory that is more visibly “in the car,” but their combined footprint is far smaller than Uber’s media business or Telenav’s active-vehicle reach. That makes them better for learning about creative, passenger tolerance, and location-triggered response than for proving national scale.
Telenav is the one to keep in a separate column from both. A 7.2 million active-vehicle pool is not a novelty deployment, and OEM integration gets closer to the dashboard inventory advertisers imagine when they talk about connected vehicles. The buying question becomes operational: which screens, which contexts, which consent layer, which reporting fields, and which DSP or platform path.
How To Price The Test
Dataintelo reports connected in-car inventory at $10-$22 CPMs, compared with $2-$5 for standard mobile display, and cites in-car display CTRs of 2.8%-4.6% versus a 0.1% mobile display average.[1] Those numbers are attractive enough to justify a test and loose enough to punish lazy planning.
The premium should not be justified by saying the passenger is captive. A person in a car may be checking messages, talking, looking outside, managing a child, or trying not to see another screen. The premium has to be justified by context: trip duration, destination intent, location relevance, dwell time, and whether the format can do something standard display cannot.
The reported 2.8%-4.6% CTR range is best read as a signal that the environment can produce higher interaction than commodity banners, not as a guaranteed response rate. The 3.2x higher brand-recall figure that Dataintelo cites from industry data compiled through Q4 2025 belongs in the same bucket: useful market context, but secondary-sourced because the public excerpt does not name the underlying original study.[1]
Uber’s 6.6x attentive-seconds claim deserves attention for a different reason. It comes from a named Uber/Lumen attention study and includes a 27% lift in brand consideration, but it measures Uber Journey Ads in the app experience during rides.[2] That makes it a strong rideshare benchmark and a reasonable robotaxi-era proxy. It does not make it a Tesla benchmark.
| Benchmark | Reasonable use | Bad use |
|---|---|---|
| $10-$22 connected in-car CPMs | Set a test CPM band for connected-car or rideshare-tablet inventory | Assume Tesla would clear at the same price if it opens supply |
| $2-$5 standard mobile display CPMs | Anchor the premium against familiar display buying | Treat in-car as a cheap reach extension |
| 2.8%-4.6% reported in-car CTRs | Frame response-rate expectations for testable in-car formats | Guarantee performance across every cabin, screen, and trip context |
| 6.6x attentive seconds for Uber Journey Ads | Benchmark rideshare app attention during trips | Represent native infotainment or autonomous-vehicle screen attention |
| 3.2x higher brand recall | Support a brand-test hypothesis | Use as independently audited proof without caveat |
What A Sensible Test Looks Like
A small in-car test should be built like a channel validation, not like a press-tour experiment. The buyer needs to know whether this inventory earns its premium against mobile display, place-based video, digital out-of-home, or rideshare app media already on the plan.
- Name the inventory source before approving budget: Uber Journey Ads, Octopus Interactive, Vugo, Telenav, or another specific platform.
- Separate screen type from trip context: phone app during a ride, back-seat tablet, OEM dashboard, or future autonomous cabin screen.
- Set the CPM comparison upfront: mobile display for performance reach, digital out-of-home for place-based attention, or CTV for longer-form passenger video.
- Use one primary success metric: attention, CTR, store visitation proxy, brand lift, app install, or offer redemption.
- Ask for the consent and privacy workflow, especially if audience, location, or trip-purpose signals are part of the pitch.
For performance teams, the first test usually should not try to prove everything. A local restaurant chain might test destination-adjacent offers in rideshare inventory. A streaming service might test attention and brand lift during longer trips. A travel advertiser might compare airport-route performance against mobile geofencing. Those are hypothetical examples, but the planning discipline is the same: one environment, one budget owner, one clean comparison.
The mistake is buying “in-car” as if it were a single media type. A phone ad served in the Uber app, a tablet mounted behind a driver, and an OEM screen in a connected vehicle may all reach someone sitting in a car. They do not have the same user posture, consent surface, reporting path, or creative burden.
Where Tesla Belongs In The Plan
Tesla belongs in the watchlist column because its installed base is too large to ignore and its ad inventory is not available to buy. The company’s 6.8 million-plus connected vehicles create a plausible future screen network; the roughly 1.5 million FSD subscribers create a more specific audience for autonomous-driving-related cabin experiences; the $99 monthly FSD subscription indicates Tesla already has a paid software relationship with a large subset of drivers.[3]
That still does not answer the buyer’s two questions: can I buy it this quarter, and what CPM should I compare it against? Today, the answer to the first is no. The answer to the second is that there is no public Tesla CPM because there is no open Tesla programmatic inventory.
The Tron: Ares promotion is useful only as a boundary marker. Tesla owners saw Tron-related promotional content in the vehicle interface, and the reaction drew coverage and backlash, but that was a sponsorship integration, not evidence that advertisers can buy Tesla screen inventory through an open marketplace.[4] It should not be cited in a media plan as launch proof.
The upside math explains why the watchlist is worth keeping. The Center of Automotive Management has estimated $100-$120 per car per year in in-car e-commerce revenue potential by 2030; applied to Tesla’s current connected fleet size, that would imply an $816 million annual opportunity at the high end.[5] That is not a Tesla forecast. It is a rough way to size why an OEM with millions of connected screens might eventually care.
The Caveats That Affect Real CPMs
In-car media has one obvious advantage and one obvious liability: the cabin is a high-context environment, and the person inside may resent the intrusion. Dataintelo reports that 38% of rideshare passengers expressed discomfort with current ad frequency in Q3 2025.[1] That is not a rounding error for a channel trying to sell attention quality.
Frequency, audio behavior, screen brightness, trip length, and dismiss controls are not product details after the deal is signed. They are part of the media quality. A high CTR bought by irritating passengers can create the wrong kind of recall, especially in a rideshare setting where the advertiser is borrowing someone else’s customer experience.
Privacy also changes the European math. Dataintelo notes that EU ePrivacy Regulation could reduce CPMs by 30%-45% in European markets.[1] A U.S. test result should not be copied into an EMEA forecast without checking whether the same targeting, consent, and measurement signals can legally travel.
The autonomous-vehicle caveat is just as important. Most in-car advertising today operates in manually driven rideshare vehicles or connected cars, not in fully autonomous fleets where every occupant is a passenger. Robotaxi inventory may eventually change creative length, attention, and commerce behavior. It is not yet the baseline for the market.
The Buyer’s Cut
If the budget has to move now, start where the inventory is real. Uber Journey Ads should be the first benchmark for scale and attention in a ride context. Aftermarket tablets can teach creative and passenger-response lessons at smaller scale. OEM-integrated pools such as Telenav deserve a separate test brief because they are closer to connected-vehicle screen inventory than rideshare app ads are.
Tesla should be monitored, not pre-bought in a spreadsheet fantasy. The trigger events are straightforward: a named Tesla ad product, a disclosed buying path, inventory controls, measurement documentation, privacy terms, and enough pricing data to compare against the $10-$22 connected in-car CPM range rather than against hope.
The near-term plan is not complicated: test small budgets on available in-car inventory, judge it against mobile display and place-based media benchmarks, and keep Tesla separate until its fleet-size story turns into buyable programmatic supply.
References
- In-Car Advertising Platform Market Research Report 2034, Dataintelo.
- Driving Attention, Delivering Results: 2025 Uber Advertising Lumen Attention Study, Uber.
- Tesla Nears 1.5 Million FSD Subscribers, 55% of New Cars Opt In, SaasRise.
- Oh Good, Teslas Have Ads Now, Motor1.
- Automakers Eye $625 Billion Opportunity in In-Car Advertising, Autoweek.
Built on this evidence
No Bidding tactic or Creative record currently cites this case file. Compare it against other results in Benchmarks.
Related benchmark reading
Report a corroborating or contradicting result
Seeing something different in your own account? Feed the data-integrity loop instead of leaving an open comment.