
How the P&G-Kelsey Mitchell Deal Tests Sponsorship ROI
The Kelsey Mitchell-P&G sponsorship is the latest high-profile deal in a booming market. This article shows performance marketers why the measurement gap means sponsorship ROI looks different from paid-media metrics, and what to verify before treating it as a channel.
- Platform
- Social Media
- Campaign type
- Sponsorship
- Spend range
- Undisclosed
- Timeframe
- 0-07-24 to 2026-07-27
- Engagement rate
- 0
- Verdict
- Mixed result
- Industry vertical
- Consumer goods
- Last reviewed
- 0-07-27
The Kelsey Mitchell P&G sponsorship ad campaign is only three days old as of July 27, 2026. P&G announced the partnership on July 24, naming Mitchell its first full-portfolio athlete ambassador across Secret, Olay, Downy, Tampax, Gillette Venus, Tide, and Mielle, with planned appearances at P&G Sports Lab during WNBA Live, community work through the Kelz Hoop Foundation, and employee engagement in Cincinnati.[1] That timing matters: there is no post-announcement record yet for sales lift, foot traffic, paid-content efficiency, search lift, or retention effects. This is not a campaign postmortem. It is a measurement read.
That distinction is not procedural nitpicking. Forrester reported that 76% of US B2C marketing executives who invested in sports sponsorships in 2024 agreed they struggle to calculate sponsorship ROI.[2] That is the load-bearing fact behind this deal. A sponsorship can be commercially smart and still be structurally incomparable to Performance Max, Advantage+, TikTok Symphony, or any other channel where the operator is expected to defend spend against CPA, ROAS, and LTV:CAC inside a weekly dashboard.
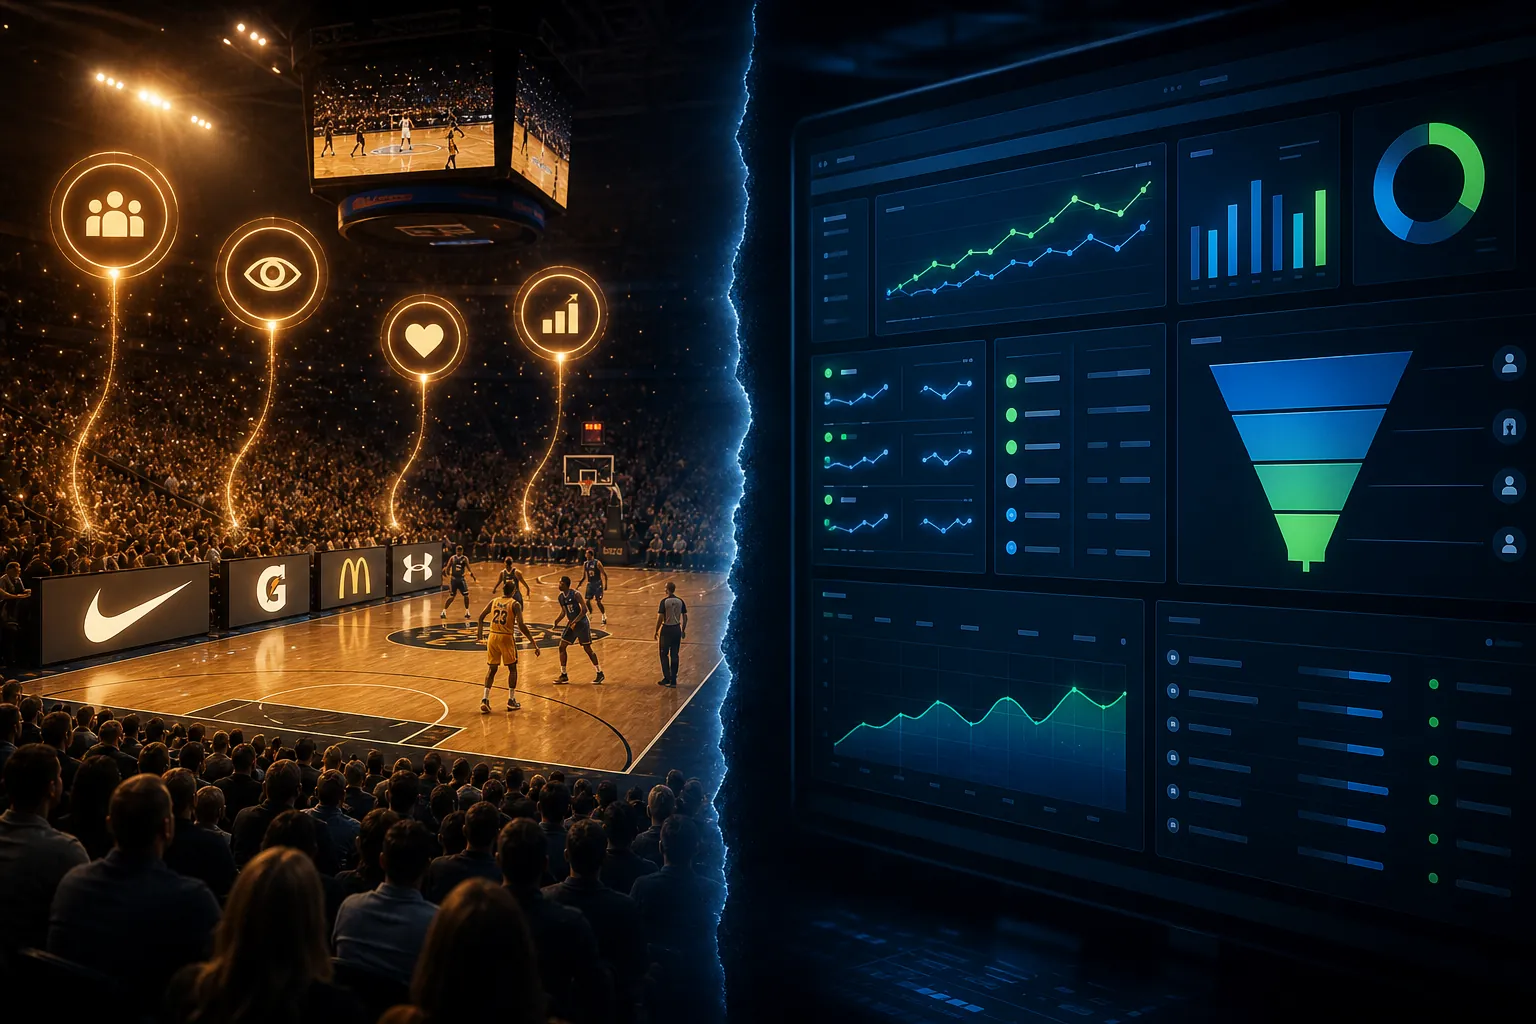
The problem is not that WNBA sponsorship is hype. The market signal is real. SponsorUnited reported that WNBA sponsorship grew 45% year over year from $72.3 million in 2024 to $105 million in 2025, while average deal size rose 21% and category growth was heavily concentrated in areas such as consumer products and healthcare.[3] WPP media investment data also put women’s sports ad spend up 69% year over year in 2025 to $127 million.[4] Those numbers explain why brand teams are moving faster. They do not prove that any one activation belongs in the same budget-review column as a lower-funnel acquisition campaign.
The market is growing faster than the measurement system
The Mitchell announcement sits inside P&G’s broader 2026 WNBA relationship. In April, the league and P&G announced a multi-brand partnership involving the same seven-brand portfolio: Secret, Olay, Downy, Tampax, Gillette Venus, Tide, and Mielle.[5] Mitchell’s role gives that portfolio a human center. That is operationally more interesting than buying a logo and hoping the board deck can call it “authenticity.”
It also makes the measurement problem more layered. A logo placement, a player appearance, a community clinic, a creator-style social asset, a retailer-adjacent beauty message, and an employee event do not all generate the same kind of evidence. Some can be counted. Some can be benchmarked. Some may be financially meaningful while never showing up in a media buyer’s conversion report.
This is where the WNBA momentum language can become sloppy. A marketer can responsibly say that sponsor demand around the league has increased. A marketer cannot responsibly say that the Mitchell deal has already generated paid-media-grade return. The first claim is market context. The second would require outcome data that does not exist yet.
What a performance marketer can actually verify
The right first pass is to separate observable surfaces from inferred value. The P&G-Mitchell deal has several surfaces worth tracking, even before anyone starts talking about sales lift.
| Component | What can be checked | What it still cannot prove by itself |
|---|---|---|
| Mitchell social content across P&G brands | Engagement rate, saves, shares, comments, view-through patterns, whitelisting performance, paid amplification efficiency | Incremental household sales or long-term brand equity without a stronger test design |
| P&G Sports Lab and WNBA Live appearances | Foot traffic, scans, dwell time, samples distributed, opt-ins, event participation | Whether attendees would have bought anyway or whether the event shifted category preference |
| All-Star weekend search behavior | Brand search lift, Mitchell-plus-brand queries, landing-page traffic, retailer search movement | Causal lift unless compared against a credible baseline or control period |
| Earned media and sponsor media value | Mentions, exposure, estimated media value, logo visibility, content pickup | A single objective ROI number, because SMV varies by vendor methodology |
| Paid reuse of athlete content | Engagement-per-dollar, thumb-stop rate, cost per landing-page view, downstream assisted conversions | That the sponsorship itself is efficient independent of media spend and creative selection |
Social content is the cleanest bridge into a performance workflow because it can be placed inside systems buyers already know. If Mitchell content is repurposed as paid creative, the question becomes more concrete: did that asset beat the account’s normal beauty, grooming, laundry, or hair-care creative on engagement-per-dollar, click-through quality, landing-page behavior, or assisted revenue? That does not measure the whole sponsorship. It measures one distributable asset class created by the sponsorship.
That difference saves a lot of internal arguing. If a Tide creative unit featuring Mitchell outperforms a control asset in paid social, the paid-media team can say the content worked in that placement. It still should not be forced to say the sponsorship paid for itself. The contract may also include appearances, employee events, community programming, PR value, relationship value, and portfolio-level brand benefits that are not represented in the media test.
Foot traffic around P&G Sports Lab has a similar boundary. Attendance, QR scans, product sampling, opt-ins, and repeat interactions are all worth counting. If P&G can compare activity during WNBA Live against a relevant baseline, the event team can learn something. But a crowded activation space does not automatically equal incremental revenue. It gives the organization a participation record and a retargeting pool; turning that into commercial proof requires additional design.
Search lift is another useful diagnostic because it catches demand that the sponsorship may stimulate outside the venue. Around All-Star weekend, P&G could watch brand queries, Mitchell-plus-brand queries, campaign landing-page activity, and retailer search behavior. The word “could” is doing work here. Without pre-period baselines, category controls, and a plan for separating league-wide WNBA attention from Mitchell-specific attention, search movement becomes a directional signal rather than a return calculation.
SMV is useful, but it is not a receipt
Sponsor media value is where sponsorship reporting often starts to sound more precise than it is. Relo Metrics reported that WNBA floor-court logos averaged 1:12 of exposure per game with a 15% media value percentage score, while NBA floor logos generated a 29% media value percentage from 1:23 of exposure.[6] Those numbers are useful for understanding relative exposure inventory. They are not the same thing as a platform-reported conversion value.
The same caution applies to player-driven social media value. Relo Metrics reported that Caitlin Clark averaged $17,200 in social media value per Instagram post for Indiana Fever partners, about 10 times the value of the Fever account’s own posts.[6] That is a flashing warning label for anyone trying to apply league-level or team-level averages to a non-Clark ambassador deal. It does not make a Mitchell partnership weak. It means the benchmark has to respect star concentration.
Vendor SMV models can help a sponsor compare placements, inventory, and exposure quality. They can also diverge because methodologies differ. A performance marketer would not accept “estimated value” from an ad platform without asking how the model assigns credit. Sponsorship should not get a looser standard just because the deck has better photography.

Athlete-content benchmarks help, with caveats
OpenSponsorship’s 2026 State of Athlete Marketing Report gives one reason marketers keep looking at athletes as a creative and media lever: in its dataset of 14.9 million posts, athlete content averaged 10.97% engagement versus 4.92% for traditional influencers, and the company reported that athlete content used in paid ads delivered 7x ROAS.[7] Those are relevant benchmarks for P&G if Mitchell content becomes paid creative across brand accounts.
They are not universal constants. The 7x ROAS figure comes from a platform-specific proprietary dataset, and the result can depend on athlete selection, audience fit, category, creative format, paid distribution, and measurement window. Signal & Convert has already covered why account-level athlete engagement rates can mislead partnership decisions. The Mitchell case needs the same discipline: compare content by topic, product fit, format, and distribution role, not just by the athlete’s headline engagement rate.
This is also where P&G’s portfolio structure matters. A full-portfolio ambassador can generate multiple content paths: beauty, body care, hair care, laundry, period care, grooming, and community programming. That gives the company more ways to test creative-market fit than a single-brand endorsement would. It also gives analysts more ways to over-attribute if they collapse all those surfaces into one blended “sponsorship ROI” figure.
The part that will not fit in the paid-media dashboard
The Mitchell deal includes employee engagement in Cincinnati and community work through the Kelz Hoop Foundation.[1] Those details are easy to treat as soft extras because they do not look like acquisition metrics. That is a mistake, but not because they secretly convert like a retargeting pool. They belong to a different accounting problem.
Sports Business Journal has described internal ROI — employee engagement, retention, recruitment, and B2B networking — as the “forgotten 50%” of sponsorship value because it is often excluded from current measurement frameworks.[8] That concept is useful here. A company like P&G may value a WNBA partnership partly because it gives employees, retail partners, community stakeholders, and multiple brand teams something to organize around. Some of that can affect business outcomes. Much of it will not be visible to the person looking at week-two CPA.
Employee engagement is not free just because it is hard to attribute. If a sponsorship creates internal events, recruiting touchpoints, leadership visibility, and community participation, the organization can measure attendance, employee feedback, participation by function, recruiting-event usage, partner meetings, and follow-up activity. Those are not vanity metrics when they are tied to an explicit internal objective. They are vanity metrics when someone later drags them into a ROAS slide to protect a media budget.
The same applies to community goodwill. Kelz Hoop Foundation engagement may create local trust and real participation. It may also generate content and PR surfaces for P&G brands. But community value should not be laundered into a fake direct-response claim. If the goal is community presence, measure participation, partner satisfaction, repeat involvement, local coverage, and follow-on programming. If the goal is incremental sales, design a sales test. Those are different jobs.
B2B networking is another sponsorship line item that performance dashboards usually miss. A WNBA Live activation can put brand teams, retailers, agencies, league contacts, and community partners in the same place. That may matter for distribution, co-marketing, retail planning, or future partnerships. The evidence there is not CPA. It is meeting quality, partner progression, commercial follow-up, and whether the sponsorship opened doors that other spend would not have opened.
What not to claim yet
The cleanest way to handle the P&G-Mitchell announcement is to mark the current evidence class before anyone starts optimizing the story for a board slide. As of now, the deal supports these claims:
- P&G has expanded its WNBA relationship into a full-portfolio athlete ambassador structure with Kelsey Mitchell.[1][5]
- The WNBA sponsorship market grew materially from 2024 to 2025, with category concentration that makes P&G’s participation unsurprising rather than random.[3]
- The sponsorship has measurable surfaces: social content, event participation, search behavior, earned exposure, employee engagement, and community activation.
- Existing athlete-marketing benchmarks suggest athlete content can be strong creative inventory, but those benchmarks need campaign-level validation before they are applied to Mitchell or P&G.[7]
- Internal ROI may be financially meaningful even when it does not map to platform CPA or ROAS.[8]
It does not yet support these claims:
- That the sponsorship has produced sales lift.
- That Mitchell content will beat P&G’s existing paid creative across every brand in the portfolio.
- That league-level WNBA sponsor benchmarks apply cleanly to this athlete, this brand mix, or this activation plan.
- That sponsorship ROI can be evaluated on the same timetable and attribution rules as PMax, Advantage+, or Symphony campaigns.
- That SMV is an objective return number rather than a modeled exposure estimate.
The practical verification path is not complicated, but it does require refusing the blended number. Put paid reuse of Mitchell content into the creative-testing system. Put event behavior into the experiential dashboard. Put earned exposure into an SMV report with methodology notes. Put search lift against a dated baseline. Put employee and partner outcomes into internal ROI tracking. Then keep those categories visible when the results are discussed.
That is the fair read of the Kelsey Mitchell P&G sponsorship ad campaign in Q3 2026: a serious sponsorship-market signal, a structurally smart portfolio fit, and a useful measurement case to track. It is not evidence that WNBA sponsorship has become a paid-media channel.
Signal & Convert should log the P&G-Mitchell announcement as a dated tracker item with the limitation stated plainly: announced July 24, 2026; activations named; post-launch performance not yet available.
References
- P&G Announces Partnership with Four-Time WNBA All-Star Kelsey Mitchell — PR Newswire, July 24, 2026. https://www.prnewswire.com/news-releases/pg-announces-partnership-with-four-time-wnba-all-star-kelsey-mitchell-302833922.html
- Sports Sponsorships Surge Despite Fuzzy ROI — Forrester. https://www.forrester.com/blogs/sports-sponsorships-surge-despite-fuzzy-roi/
- Breakout Plays: The Trends Winning Sports Sponsorship in 2026 Women’s Sports — SponsorUnited, March 2026. https://www.sponsorunited.com/insights/breakout-plays-the-trends-winning-sports-sponsorship-in-2026-womens-sports
- WPP media investment data.
- WNBA and Procter & Gamble Announce Multiyear Partnership — WNBA, April 7, 2026. https://www.wnba.com/news/wnba-procter-and-gamble-partnership
- Relo Metrics shares sponsorship value insights for top pro US sports leagues, including the WNBA — The Gist, February 2025. https://www.thegistsports.com/article/relo-metrics-shares-sponsorship-value-insights-for-top-pro-us-sports-leagues-including-the-wnba/
- State of Athlete Marketing 2027 — OpenSponsorship. https://opensponsorship.com/learn-more/state-of-athlete-marketing-2027
- Unlocking the forgotten 50% of sports sponsorship ROI — Sports Business Journal, October 7, 2025. https://www.sportsbusinessjournal.com/Articles/2025/10/07/unlocking-the-forgotten-50-of-sports-sponsorship-roi/
Built on this evidence
No Bidding tactic or Creative record currently cites this case file. Compare it against other results in Benchmarks.
Related benchmark reading
Report a corroborating or contradicting result
Seeing something different in your own account? Feed the data-integrity loop instead of leaving an open comment.