
Are Amazon's AI Product Image Claims Reliable?
Amazon claims AI-generated product images boost ROAS by 10.3% and CTR by 40%. This analysis examines the format-specific, category-skewed conditions behind those numbers and provides a controlled testing framework for advertisers.
- Platform
- Amazon Ads
- Campaign type
- Sponsored Brands
- Spend range
- Various
- Timeframe
- Apr 0–Jun 2025; 2023
- ROAS
- 0%
- Verdict
- mixed result
- Industry vertical
- ecommerce
- Last reviewed
- 0-07-30
Amazon’s two cleanest AI image numbers do not belong in the same client slide without footnotes. The 10.3% ROAS lift comes from Amazon internal US data for Sponsored Brands campaigns in April through June 2025. The 40% CTR lift comes from a 2023 Amazon internal US comparison of mobile Sponsored Brands ads using lifestyle images versus standard product images.[1] Both can be true. Neither says that AI-generated product images for advertising in 2026 will lift every campaign, placement, category, or budget plan.
That distinction matters because the advertiser does not get graded on whether Amazon’s aggregate is directionally encouraging. The advertiser gets graded on whether the next test produced more efficient revenue, whether ACOS moved, whether conversion held, and whether the creative budget could have been spent somewhere else.
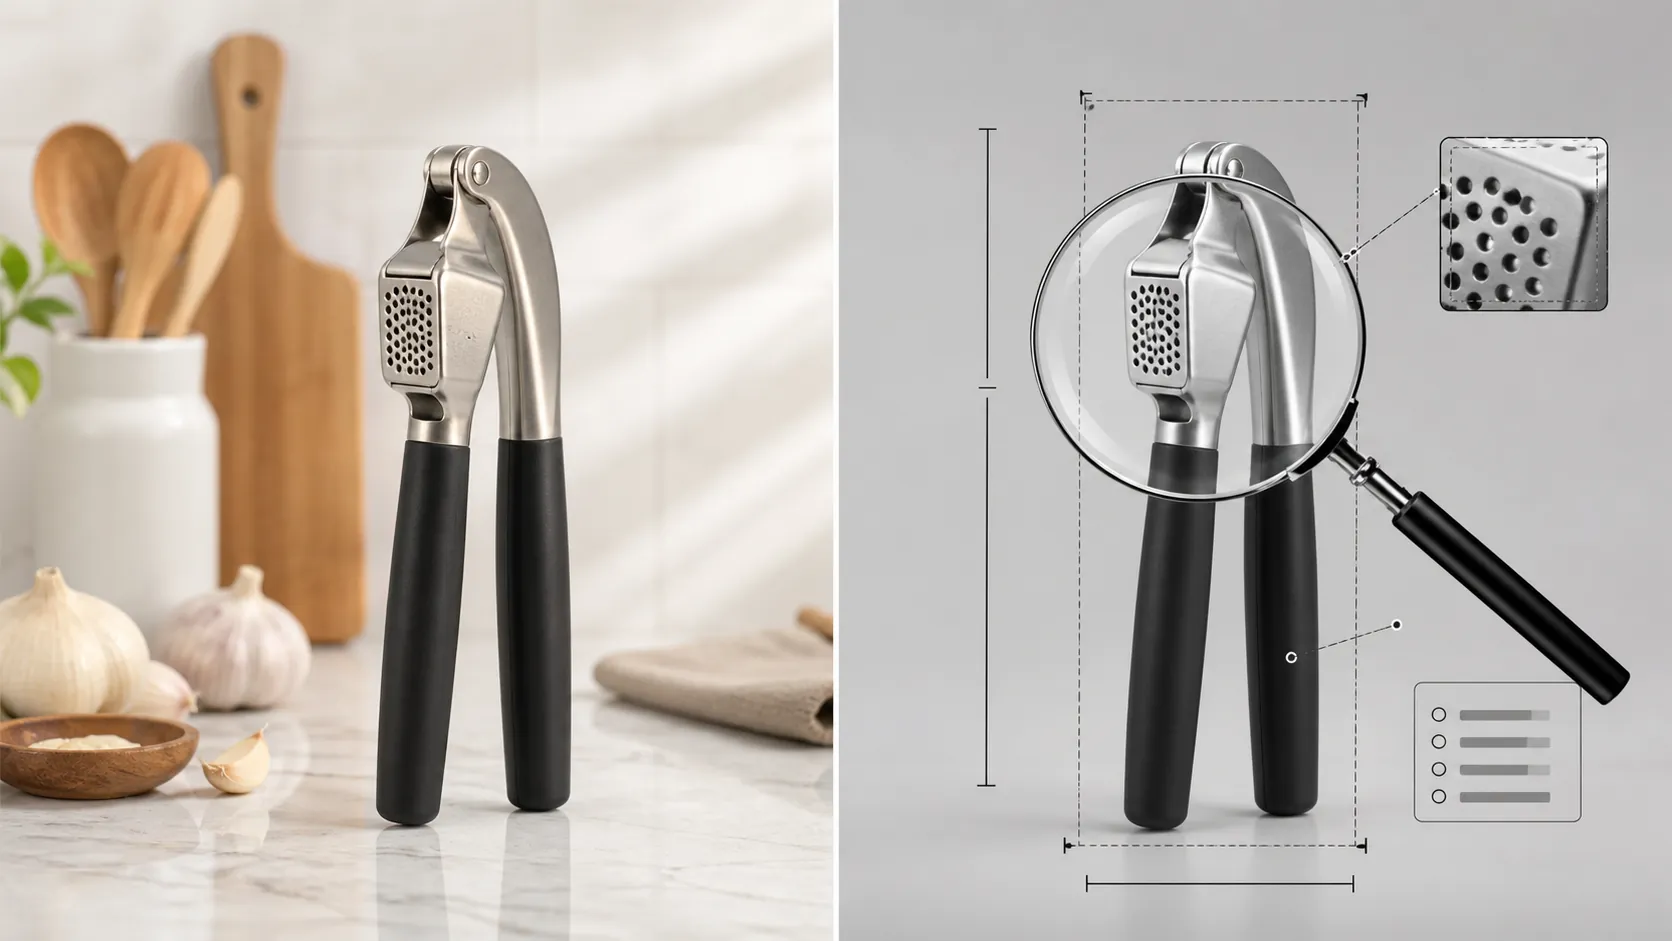
The 10.3% ROAS Claim Is Narrower Than It Looks
The 10.3% figure is the more useful of Amazon’s two headline claims because it is closer to how advertisers actually buy media. ROAS at least speaks to revenue returned against ad spend. But the source conditions are doing a lot of work: Amazon describes the figure as internal US data from April through June 2025, tied to Sponsored Brands campaigns, not to Sponsored Products, Sponsored Display, DSP, Stores, or organic listing performance.[1]
That makes it a format-specific vendor signal. It does not tell a seller whether an AI-generated lifestyle image will improve a Sponsored Products placement where the main image rules, a Sponsored Display retargeting unit, or a desktop-heavy campaign where the creative field and shopper intent differ. It also does not isolate the mechanism. A ROAS lift can come from better click-through rate, cheaper effective traffic, different auction dynamics, better pre-click qualification, or a category mix that happens to favor contextual images.
For budget planning, the dangerous move is treating 10.3% as a portable benchmark. A Sponsored Brands account with weak product-only creative, a simple visual use case, and enough traffic to test may have a fair reason to try Amazon’s image generator. A brand already using polished lifestyle photography may simply be testing a cheaper production route, not a new performance ceiling.
The 40% CTR Claim Is Even More Placement-Bound
The 40% CTR claim is easier to overuse because it sounds dramatic and sits high in the funnel. Amazon’s own framing ties it to 2023 internal US data comparing mobile Sponsored Brands ads with lifestyle images against ads using standard product images.[1] That is not a general AI-image result. It is a mobile Sponsored Brands lifestyle-image result.
Mobile Sponsored Brands is a specific environment. The shopper is moving through a small screen, the ad has a visual interruption job to do, and a plain catalog shot can disappear beside richer surrounding content. A lifestyle image can win the tap without proving that the product page converts better, that the offer is stronger, or that the image would perform the same way on desktop.
CTR can still matter. In Amazon auctions, a stronger click-through rate may improve traffic quality and media efficiency enough to show up downstream in ROAS. But that is not the same as proving that AI images raise conversion rate directly. If the new image attracts more curiosity clicks from less-qualified shoppers, CTR can rise while ACOS stays flat or worsens. The test has to watch both the click and the bill.
| Amazon claim | What it measures | Stated scope | What it does not prove |
|---|---|---|---|
| 10.3% higher ROAS | Return on ad spend for campaigns using AI-generated images | Amazon internal US data, Sponsored Brands, Apr-Jun 2025 | Performance in Sponsored Products, Sponsored Display, desktop-specific inventory, or every category |
| 40% higher CTR | Click-through rate for lifestyle-image ads versus standard product-image ads | Amazon internal US data, mobile Sponsored Brands, 2023 | Conversion-rate lift, profit lift, or repeatable performance outside mobile Sponsored Brands |
Amazon has also published earlier context around AI creative, including a 10% first-month sales figure and a 5% GMS lift from January through September 2024 data.[1] Those numbers are useful as a sign that Amazon has been seeing commercial movement around the tool for more than one reporting window. They should not crowd out the cleaner 2025 ROAS and 2023 mobile Sponsored Brands CTR claims, because those are the numbers advertisers are most likely to repeat in planning conversations.
Where the Dandy Blend Case Helps, and Where It Stops
The Dandy Blend and Trellis case is useful because it shows what a strong execution can look like when the process is not casual. In Amazon Ads’ case study, Trellis tested more than 200 image variants for Dandy Blend, a beverage brand. The reported results were an 83% CTR increase from 0.6% to 1.1%, 2.2x conversions, and ACOS moving from 7.0% to 6.8%.[2]
Those are good numbers. They are also not an average advertiser benchmark. This is one brand, in one category, in an Amazon Ads-published success case, with an agency testing more than 200 variants.[2] The creative operation is part of the result. If a seller generates three images on a Friday and swaps one into a live campaign Monday morning, they are not replicating that case. They are borrowing its optimism.
The most interesting detail is not only that CTR rose. It is that conversions also increased while ACOS barely improved, moving from 7.0% to 6.8%.[2] That shape is exactly why a media buyer should resist treating CTR as the victory condition. More clicks and more conversions can still leave efficiency close to unchanged if costs, order value, or conversion quality do not move enough.
The Categories Most Likely to Benefit Are Not the Ones With the Prettiest Brand Books
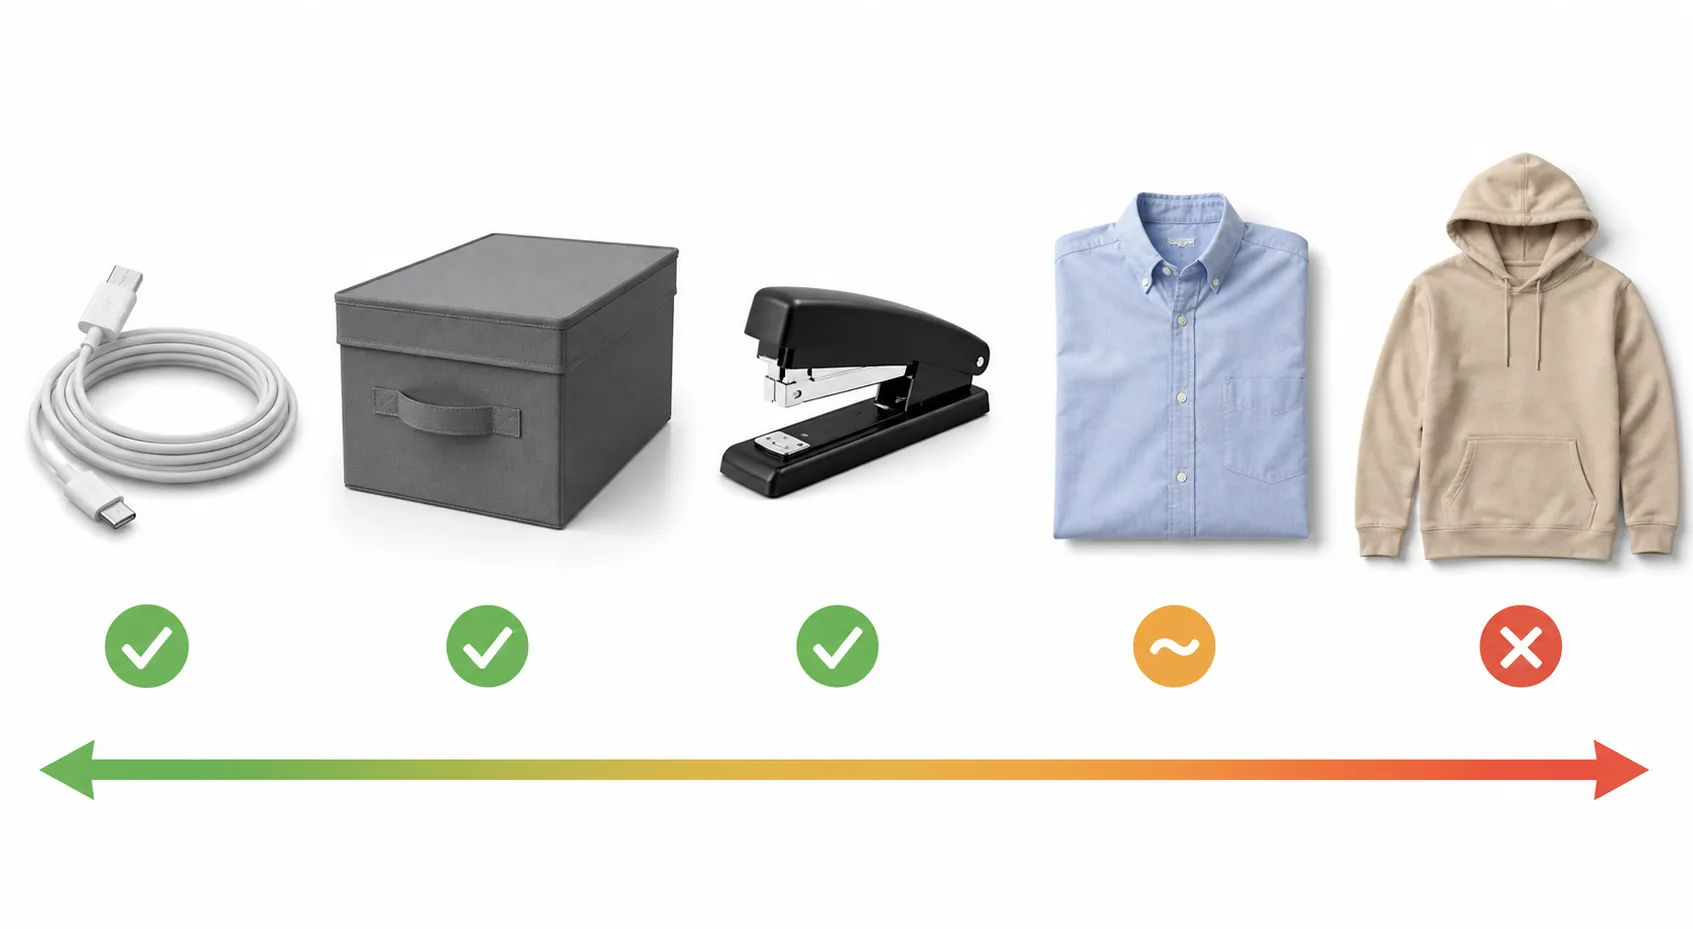
The best case for Amazon’s AI image generator is not that it beats professional creative in every category. The better case is more practical: many sellers have never had usable lifestyle assets at all. For a cable, storage bin, desk organizer, small tool, or office supply, the old baseline may be a white-background product shot and nothing else.
SellerMetrics’ category analysis argues that functional and commodity products often see the largest gains because AI-generated context helps shoppers understand use, scale, and setting where the original image set was thin. The same analysis treats fashion and apparel more cautiously, citing problems around fabric behavior, hands, and human-scale accuracy.[3] That is synthesized category guidance, not a controlled statistical study, so it should guide test priority rather than settle the question.
This is where the tool deserves some credit. A commodity seller with no lifestyle library has a real production bottleneck. If Amazon can turn a plain catalog shot into a compliant, plausible use-context image quickly enough to test, that is not a gimmick. It is a way to get from no creative hypothesis to a measurable one.
Fashion, apparel, beauty involving skin application, and products where fit or human interaction carries the sale need a tighter review loop. The issue is not only brand taste. If the AI image misrepresents scale, texture, drape, hand position, or use conditions, the ad may earn attention for a promise the product page cannot responsibly support. That can turn a CTR lift into a conversion or compliance problem.
A Test That Does Not Fool the Buyer
The right response to Amazon’s claims is not to ignore the image generator. It is to test it inside the exact conditions where the result would influence spend. That means matching the campaign format, placement mix, category, product maturity, and existing creative baseline instead of asking one blended account result to answer everything.
- Start with one format: Sponsored Brands is the cleanest starting point because Amazon’s two main claims both sit there.
- Separate mobile and desktop reporting where possible; do not let a mobile CTR gain hide a desktop loss.
- Hold the product set stable so the test measures creative, not a different SKU mix.
- Compare against the real current baseline: plain catalog shot, existing lifestyle creative, or professionally produced image.
- Judge CTR, CPC, CVR, ROAS, ACOS, and ordered revenue together; do not promote CTR into a full-funnel result.
A clean test can be simple. Pick a campaign where Sponsored Brands already has enough volume to read changes without waiting months. Keep the keyword or product targeting structure stable. Run the AI-generated image against the current image with the same landing destination and similar budget exposure. If the account cannot support a strict split, at least avoid changing bids, targeting, product mix, and creative at the same time.
The metric hierarchy should be written before the test starts. For a prospecting Sponsored Brands campaign, CTR and CPC may be early indicators, but ROAS and ACOS decide whether the creative deserves more budget. For a branded-defense campaign, a small CTR lift may not matter if the campaign was already efficient and mostly capturing existing demand. For a launch campaign, the acceptable ACOS range may be wider, but the buyer still needs to know whether the image created qualified demand or just cheaper-looking traffic.
Creative review also belongs inside the test design, not after the report. Someone should check whether the generated scene changes the implied product size, use case, bundle contents, ingredients, material, or audience. That review is especially important when the product’s value depends on human fit, texture, or before-and-after expectations.
The Minimum Readout
| Question | Why it matters |
|---|---|
| Did CTR improve by placement and device? | This checks whether the image actually changed shopper attention in the environment being tested. |
| Did CPC or effective traffic cost change? | CTR can affect auction efficiency, which may explain ROAS movement without proving conversion-rate lift. |
| Did CVR hold, rise, or fall? | This catches curiosity clicks that do not convert. |
| Did ACOS and ROAS improve enough to matter? | The advertiser buys against efficiency, not just engagement. |
| Did the result differ by product type? | A commodity SKU and a fashion SKU should not be averaged into one creative conclusion. |
This is also why campaign records need to be read in context. A benchmark such as Signal & Convert’s Samsung Fold 8 Amazon Trade-In Ads benchmark is useful as an example of how specific Amazon ad performance evidence should be handled: by campaign type, placement assumptions, and measured outcome. It is not evidence about AI images, and it should not be used that way.
What a Responsible Buyer Can Take From Amazon’s Claims
Amazon’s AI image performance numbers are credible as vendor-sourced internal signals for specific ad conditions. The 10.3% ROAS lift belongs to US Sponsored Brands data from April through June 2025. The 40% CTR lift belongs to a 2023 US mobile Sponsored Brands comparison of lifestyle images against standard product images.[1] The Dandy Blend case shows a successful beverage example with heavy variant testing, not a universal expectation.[2]
That is enough reason to test Amazon’s image generator, especially for functional products stuck with weak catalog-only creative. It is not enough reason to forecast a 10.3% ROAS lift, promise a 40% CTR gain, or move budget away from proven creative before the account has its own read. The claim becomes useful only after it is narrowed to the advertiser’s vertical, placement mix, creative baseline, and metric hierarchy.
References
- AI-powered image generation for advertising, Amazon Ads
- Dandy Blend and Trellis creative success, Amazon Ads
- Amazon AI Product Images, SellerMetrics
Built on this evidence
No Bidding tactic or Creative record currently cites this case file. Compare it against other results in Benchmarks.
Related benchmark reading
Report a corroborating or contradicting result
Seeing something different in your own account? Feed the data-integrity loop instead of leaving an open comment.