
Can you verify Pinterest's Q2 AI ad revenue claims?
Pinterest restated Performance+ AI-ad claims on its Q2 call. We separate platform-reported figures from what independent evidence supports and show buyers what to verify in their own accounts.
- Platform
- Change category
- bidding
- Effective date
- 2026-08-04
- Change type
- opt-in feature
- Impact level
- moderate
Pinterest’s Q2 report created the kind of uncomfortable split that paid-media buyers should recognize: the company beat headline estimates, shares still fell after hours by roughly the high single digits depending on the source, and management restated several AI-advertising claims that sound useful but remain platform-reported rather than independently audited. Q2 revenue was $1.1797 billion, up 18% reported and 17% in constant currency, while adjusted diluted EPS was $0.43 versus the roughly $0.36 LSEG consensus cited by CNBC.[1][2] CNBC described the after-hours drop as about 7%, Reuters as about 9%, and Investing.com put the decline in an 8.49% to 9.23% range to $23.22 to $23.41.[2][3][4]
That stock move is the occasion for scrutiny, not the main issue. The buyer-side question is narrower: which AI-ad claims can an advertiser actually verify before moving more lower-funnel budget into Performance+?
| Pinterest claim | Timing or product context | Source | Evidence label | What a buyer can verify |
|---|---|---|---|---|
| Performance+ represented roughly 30% of lower-funnel revenue. | As of Q1 2026; restated on the Q2 2026 call, not newly disclosed as a Q2 figure. | Pinterest earnings call transcript.[5] | Platform-reported adoption/revenue-share claim; no independent audit in the available materials. | A buyer can check their own spend mix and revenue outcomes for Performance+ versus non-Performance+ lower-funnel campaigns, but cannot verify Pinterest’s platform-wide share. |
| Advertisers adopting Performance+ grew lower-funnel spend more than 2x faster than non-adopters. | Restated on the Q2 2026 call as part of management’s Performance+ commentary. | Pinterest earnings call transcript.[5] | Platform-reported spend-growth comparison; adoption and spend growth are not the same as incremental return. | A buyer can compare spend growth only inside their own account, and should separate budget shift from proven incremental revenue. |
| SMB advertisers testing ROAS bidding saw a 28% improvement in ROAS. | ROAS bidding test discussed on the Q2 2026 call. | Pinterest earnings call transcript.[5] | Platform-reported test result; no disclosed independent audit, sample detail, or buyer-side replication in the available materials. | A buyer can run a controlled test against existing lower-funnel bidding, using consistent attribution windows and holdout logic where possible. |
| Smart Assembly delivered about a 6% average CTR gain in early alpha. | Q2 2026 Smart Assembly alpha. | Pinterest earnings call transcript.[5] | Platform-reported creative/CTR lift; CTR is not ROAS, and alpha results are not broad-market proof. | A buyer can test CTR, conversion rate, CPA, and post-click value separately to avoid mistaking cheaper attention for profitable demand. |
| Open-weight models can run at less than 8% of the cost of closed models. | Infrastructure-cost claim discussed on the Q2 2026 call. | Pinterest earnings call transcript.[5] | Platform-reported cost-efficiency claim; useful for Pinterest’s margin story, not direct proof of advertiser return. | A buyer generally cannot verify Pinterest’s model-cost base; they can only watch whether lower serving costs translate into better auction outcomes or tools. |
| Clicks to advertisers are up more than 5x over three years, while revenue has not followed in the same way. | CEO Bill Ready’s monetization-gap framing on the Q2 2026 call. | Pinterest earnings call transcript.[5] | Platform-reported business diagnosis; important because it points to attribution and monetization, not just supply growth. | A buyer can inspect whether Pinterest is under-credited in their own measurement system before treating click growth as performance growth. |
The clean read is not that these numbers are wrong. It is that each sits on the vendor side of the ledger. The difference matters when the next budget meeting asks whether Pinterest deserves more lower-funnel spend or merely more testing room.
The investor story explains scrutiny; it does not verify Performance+
Pinterest had enough operating momentum to make the immediate selloff look, at first glance, harsh. Monthly active users reached 640 million, up 11%, which the company called its twelfth consecutive record quarter. Global ARPU rose 7% to $1.86, and UCAN ARPU rose 14% to $8.30. Adjusted EBITDA was $311 million, up 24%, with a 26% margin.[1]
There were also reasons for investors to question the slope of the revenue line. Pinterest guided Q3 revenue to $1.19 billion to $1.21 billion, implying 13% to 15% growth, and Reuters framed the guidance against intensifying AI-ad competition from Meta’s Advantage+ tools, Reddit’s similar product, OpenAI’s expanding ads business, and Google’s AI-powered Google Images changes.[1][3] The company also reported a GAAP net loss of $47 million, with share-based compensation of $319.7 million in the quarter.[1]
For a demand-side companion to the earnings move itself, the useful background is the split between impression growth, pricing, and Q3 drag; that belongs in a stock-event or guidance bridge, not in the proof file for Performance+. The existing Pinterest stock drop context and Pinterest Q3 2026 revenue guidance pieces are the better place for that.
The media-buyer story starts where the earnings story stops. Revenue, MAUs, ARPU, impressions, pricing, and adjusted EBITDA tell you whether Pinterest is scaling and monetizing. They do not tell you whether a Performance+ campaign in a specific account is producing incremental ROAS.
Why the monetization gap matters more than the MAU record
The most useful sentence on the call was not the one about 640 million users. It was Ready’s admission that clicks to advertisers have increased more than 5x over three years, while revenue has not increased in the same way.[5]
That is not a trivial disclosure for a commerce-intent platform. If Pinterest is sending far more outbound advertiser clicks but not monetizing proportionally, the problem may sit in measurement, attribution, auction confidence, conversion quality, or some mix of all four. A buyer defending budget does not solve that by pointing to user growth. They solve it by showing whether Pinterest is under-credited by the current measurement stack, over-credited by platform attribution, or genuinely improving.
This is where Performance+ could become valuable. Pinterest is a planning and discovery environment with real purchase intent. A cleaner lower-funnel automation product would be useful. But “useful if true” is not the same standard as “verified in my account.”
The Performance+ revenue-share claim is adoption, not effectiveness
The roughly 30% figure deserves careful dating. Pinterest said in its Q1 2026 product discussion that Performance+ had grown to nearly 30% of lower-funnel revenue; on the Q2 call, management restated that position rather than giving a new Q2-specific share.[5][6]
That distinction is small only if you read earnings calls as marketing collateral. For an operator, it changes the evidence label. A Q1 adoption-share figure tells you the product has distribution inside Pinterest’s lower-funnel business. It does not tell you whether those dollars outperformed the campaigns they displaced, whether advertisers increased total Pinterest budgets because of Performance+, or whether lower-funnel revenue share changed again in Q2.
The same caution applies to the “more than 2x faster” spend-growth claim for adopters. Spend growth can reflect confidence, budget reallocation, sales coverage, promotional pressure, or product performance. Without matched advertiser cohorts, incrementality treatment, and disclosed baselines, it remains a platform-reported adoption-and-spend signal.[5]
ROAS bidding and Smart Assembly are closer to buyer value, but still not buyer proof
The 28% ROAS improvement for SMB advertisers testing ROAS bidding is the most tempting number in the set because it speaks the buyer’s language. It is also exactly the kind of number that needs a methodology before it should change a budget plan. Pinterest described the result on the Q2 call, but the available materials do not provide an independent audit, a public sample design, or enough detail to know how advertiser selection, campaign maturity, attribution windows, and optimization history were handled.[5]
The Smart Assembly claim is more modest and easier to place. Pinterest said early alpha results showed about a 6% average CTR gain.[5] That is directionally interesting for creative assembly. It is not, by itself, a lower-funnel case. CTR can rise while conversion rate falls, average order value changes, or post-click quality weakens. A buyer should want to know whether the assembled creative improves contribution profit or incremental ROAS, not only whether it earns more clicks.
The open-weight model cost claim belongs in a different bucket. Running models at less than 8% of the cost of closed models may matter for Pinterest’s infrastructure economics and product velocity.[5] It is not a buyer-side performance claim unless lower model cost shows up as better bidding, better creative testing, lower waste, or measurable auction efficiency in the account.
Independent sources add skepticism, not verification
The outside coverage does not independently validate Pinterest’s Performance+ claims. Reuters supplied the competitive frame and quoted Emarketer analyst Marisa Jones saying Pinterest’s AI tools “have shown early promise, but they haven't generated the same level of enthusiasm as competitors' offerings.”[3]
That quote is useful because it prevents the platform narrative from floating alone. It is not a substitute for account-level performance evidence. Analyst skepticism is still sentiment unless it is tied to advertiser data, audited lift studies, or disclosed buyer benchmarks.
The same standard should be applied consistently across platforms. Meta, Google, Reddit, OpenAI, and Pinterest all have incentives to turn AI-product adoption into a story about inevitability. A practical claims protocol — like the vendor-claim versus independently confirmed approach used in the site’s AI capex and digital ad spend verification scorecard — keeps the label attached to the evidence, not to the brand.
The product timeline is moving toward measurement, which is the right direction
Pinterest’s automation roadmap is not empty. Performance+ launched globally in October 2024, and Pinterest’s own business help materials describe it as an automated campaign setup and optimization product for advertisers.[7] In Q1 2026, Pinterest added native A/B testing, expanded PinRec site-wide, and introduced Canvas real-time editing capabilities.[6]
The Q2 2026 additions are more important for verification because they start to connect automation with measurement. On the call, Pinterest discussed Smart Assembly, measurement-integrated bidding pilots, and Pinterest Assistant. Management also said tvScientific capabilities are expected to be integrated into Performance+ by 2027.[5]
The Q3 2026 expansion of measurement-integrated bidding pilots is the next checkable event. If those pilots let advertisers tie bidding to their own lifetime-value systems or incremental-ROAS measurement, the evidence can move closer to the buyer’s source of truth. Until then, Q2’s AI-ad figures remain platform-reported directional claims.
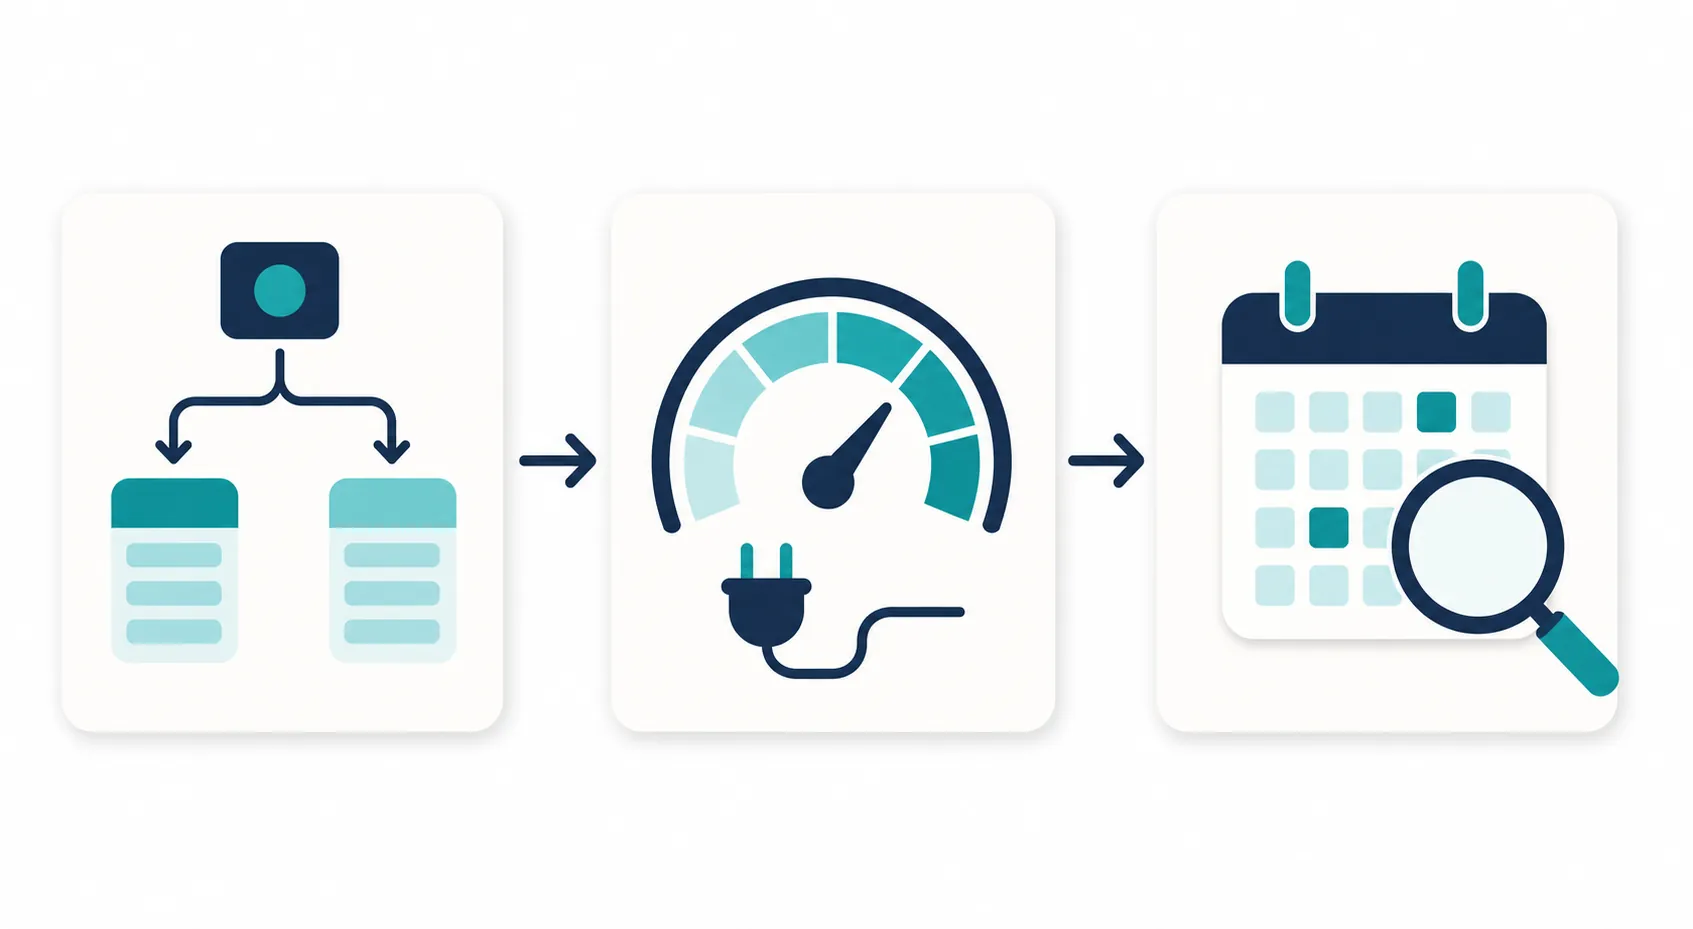
What to test before moving more budget into Performance+
A buyer does not need to reject Performance+ to be disciplined about it. The practical move is to keep two scoreboards: one for Pinterest-reported lift and one for observed account lift. The first may justify a test. The second decides whether the test earns budget.
- Run Performance+ against comparable non-Performance+ lower-funnel campaigns, not against a vague historical average. Keep audience, product set, geo, budget pacing, and conversion windows as stable as the account allows.
- Separate platform-attributed ROAS from your own observed ROAS. If your finance team uses contribution margin, LTV, or incrementality-adjusted return, do not let a Pinterest UI number replace that standard.
- Treat the 28% ROAS and 6% CTR figures as benchmark prompts, not targets. They are useful for sizing expectations, but they are not guarantees for your account.
- Watch for budget reallocation effects. If Performance+ receives the cleaner conversion pool or the most stable product feed, its apparent lift may partly reflect setup quality rather than automation quality.
- Wire in measurement before trusting bidding claims. The Q3 measurement-integrated bidding pilots matter only if the optimization goal can connect to your own LTV or incremental-ROAS logic.
- Document the date of each claim. The nearly 30% lower-funnel revenue share belongs to Q1 2026 context; do not treat it as a fresh Q2 adoption number unless Pinterest discloses one.
For creative automation, use the same restraint. A Smart Assembly test should report CTR, CPC, conversion rate, CPA, ROAS, and post-click value. If CTR improves but the revenue metric does not, the tool may still be useful for prospecting or creative throughput, but it has not proven the lower-funnel claim.
The standard is the same one buyers should apply to any generative or automated paid-social tool: label vendor-sourced results, flag confounders, and avoid treating platform case-study lift as portable proof. The site’s generative creative paid-social case study framework uses that separation for exactly this reason.
The current verification status
Pinterest has a plausible product direction and a real commerce surface. It also has a Q2 AI-ad claim set that remains unaudited in the available public record: Performance+ lower-funnel revenue share, adopter spend growth, ROAS bidding lift, Smart Assembly CTR lift, and model-cost efficiency all come from Pinterest’s own disclosures.
That leaves the buyer with a narrow but workable path: test Performance+ against non-Performance+ lower-funnel campaigns, keep vendor-reported lift separate from account-observed lift, connect bidding to your own measurement before relying on automation claims, and treat the Q3 2026 expansion of measurement-integrated bidding pilots as the next item worth checking.
References
- Pinterest Announces Second Quarter 2026 Results, Business Wire, August 4, 2026.
- Pinterest (PINS) Q2 2026 earnings report, CNBC, August 4, 2026.
- Pinterest expects slower quarterly revenue growth as ad competition heats up, Reuters, August 4, 2026.
- Earnings call transcript: Pinterest beats Q2 2026 estimates, shares reverse after hours, Investing.com, August 4, 2026.
- Pinterest (PINS) Q2 2026 Earnings Call Transcript & Audio, StockAnalysis.
- Pinterest Q1 2026: what the ad platform changes mean for advertisers, ppc.land.
- Pinterest Performance+ | Pinterest Business help, Pinterest Business Help.
Primary source: https://investor.pinterestinc.com/news/news-details/2026/Pinterest-Announces-Second-Quarter-2026-Results/default.aspx