
Use TradingView to Track Consumer Sentiment for Q3 Marketing
With consumer sentiment at historically rare lows, marketing teams need a reliable data source for campaign decisions. This guide explains how to use TradingView's free tools to monitor key sentiment indices and translate readings into specific messaging, budget, and channel adjustments for Q3 2026.
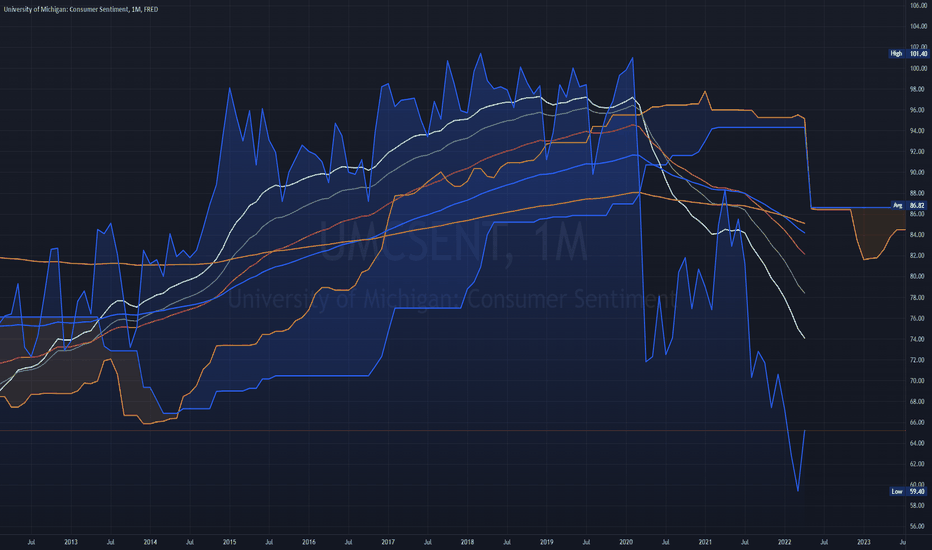
The Q3 marketing problem starts with a number that is hard to soften: the University of Michigan Consumer Sentiment Index fell to 44.8 in May 2026, an all-time record low on the TradingView FRED:UMCSENT chart and lower than reference points marketers often use for the 2008 financial crisis and the 1980 recession. Since the 1950s, readings below 80 have appeared only about 10% of the time; below 60 is not just a gloomy month, it is deep inside a historically rare zone.[1]
The preliminary July reading improved to 54.4, beating consensus expectations of 51.0, with gains across age, income, and wealth groups and some help from easing gasoline prices. That is useful, but it is not a clean recovery signal. Sentiment was still 12% below July 2025 levels, and the preliminary survey was collected before the July 7 resumption of U.S. strikes against Iran and later gasoline-price increases, so the final July reading due July 31 could change the Q3 read materially.[2]
For a marketing team, the point is not to forecast the economy. The point is to stop treating consumer mood as a soft anecdote when it is already changing the burden of proof inside campaigns. A below-60 environment affects what a claim has to prove, how much friction an offer can tolerate, how long a media plan should stay locked, and whether a premium message sounds confident or oblivious.
The Q3 Snapshot Marketers Should Actually Use
The University of Michigan index gives the sharpest current warning, but it should not sit alone. The Conference Board Consumer Confidence Index came in at 91.2 in June 2026. Its Present Situation Index was 116.4, down 3.0 points, while its Expectations Index was 74.4, up 3.0 points.[3] That split matters because it describes a consumer who may still be transacting today while preparing emotionally for worse conditions six months out.
| Signal | Latest Reading in Brief | Marketing Interpretation |
|---|---|---|
| University of Michigan Consumer Sentiment | 44.8 in May 2026; 54.4 preliminary in July 2026 | Treat Q3 as a value-and-proof environment, not a broad rebound. |
| Conference Board Consumer Confidence | 91.2 in June 2026 | Confidence is weak enough to justify caution, but not identical to the Michigan reading. |
| Present Situation vs. Expectations | 116.4 vs. 74.4 in June 2026 | Consumers may keep buying near-term while resisting long commitments or discretionary upgrades. |
| Inflation Expectations | One-year expectations eased to 4.2% in July from 4.6% in June; long-run expectations held at 3.3% | Big-ticket willingness remains constrained even when the headline improves. |
That gap between present conditions and expectations is where many Q3 plans can go wrong. A dashboard may still show conversion volume. Store traffic may not collapse. A back-to-school or late-summer promotion may still work. But a consumer bracing for worse conditions asks for more justification before upgrading, financing, subscribing, gifting, or buying ahead.
The narrower sub-indices keep this from turning into a lazy “discount everything” recommendation. Buying conditions for durables rose 20% month over month in July 2026, and planned buying intentions for autos and homes rose modestly in June 2026.[4][3] That supports a more specific read: pent-up demand may still exist, but it needs a safer purchase frame.
How TradingView Fits Into the Workflow
TradingView is useful for marketers because it puts the major sentiment series, release dates, chart thresholds, alerts, and market proxies in one place. It does not replace customer research, media reporting, or finance data. It gives the team a shared monitoring layer before a planning meeting turns into a debate over whose anecdote is more convincing.
Start with two symbols: FRED:UMCSENT for the University of Michigan Consumer Sentiment Index and ECONOMICS:USCCI for the Conference Board Consumer Confidence Index. TradingView provides chart pages for both series, so a marketer can monitor the Michigan index’s long historical context and the Conference Board’s monthly confidence read without building a custom economics database.[1][5]
- Add FRED:UMCSENT to a dedicated sentiment watchlist.
- Add ECONOMICS:USCCI beside it, so confidence is not reduced to one survey.
- Add a consumer discretionary versus staples proxy, such as XLY/XLP, to compare attitudes with market behavior.
- Mark working thresholds at 60, 80, and 100, then discuss campaign posture by zone rather than by month-to-month noise.
- Use the Economic Calendar to track the mid-month preliminary Michigan release, the end-of-month final Michigan release, and the Conference Board’s last-Tuesday monthly release timing.[6]
The free boundary is important. Charting and watchlist access for FRED:UMCSENT and ECONOMICS:USCCI are available without turning TradingView into an enterprise analytics contract. Some conveniences, including multiple chart layouts, extended historical data export, and priority calendar filters, may require a paid plan. For most marketing teams, the first useful step is not a subscription debate; it is putting the same sentiment references in front of brand, media, creative, and finance.
Set Alerts Around Decisions, Not Curiosity
Alerts are most useful when they map to a pre-agreed action. If UMCSENT crosses back above 60, that may trigger a creative review, not an automatic return to aspirational messaging. If it approaches 80, the team can revisit campaign duration and budget caps. If confidence moves higher while expectations stay weak, the change is not enough to loosen every control.
| Threshold or Pattern | What to Review |
|---|---|
| UMCSENT below 60 | Value framing, proof density, flexible payment, discount versus bundle testing, shorter flights |
| UMCSENT 60 to 80 | Gradual expansion of creative testing, but with continued offer discipline |
| UMCSENT 80 to 100 | More room for discretionary and lifestyle-led positioning, depending on category data |
| Present conditions stronger than expectations | Avoid overcommitting to long-lead campaigns; keep budget reallocation windows open |
| XLY weak versus XLP | Assume consumers are favoring needs over wants until first-party data proves otherwise |
What Changes When Sentiment Is Below 60
Below 60, the campaign job changes. The audience may still want the product, but the purchase has to feel easier to defend. That affects messaging before it affects media math.
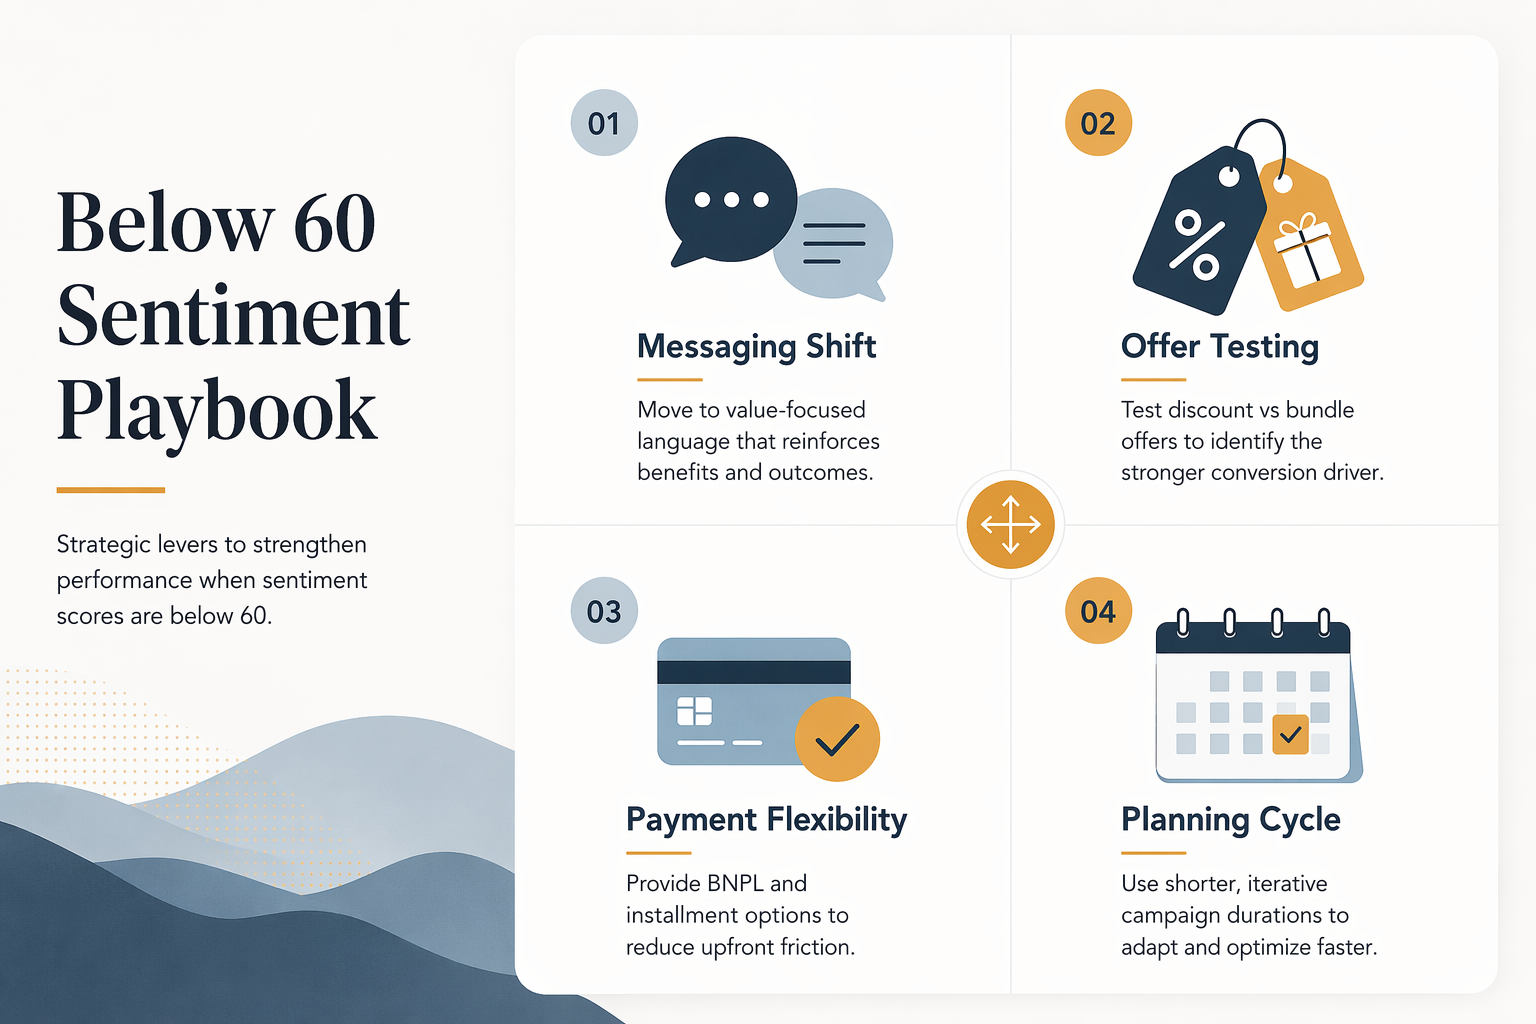
Aspirational creative does not have to disappear, but it should stop carrying the whole argument. In a stronger sentiment environment, “upgrade your routine” can work as a sufficient emotional frame. In a below-60 environment, the same claim needs a practical bridge: lower waste, longer use, fewer replacements, easier maintenance, time saved, risk reduced, or a clearer total-cost argument.
The creative review should look for unsupported premium cues. Expensive-looking environments, indulgent language, vague transformation claims, and status-coded imagery can still perform for some segments, but they need to be tested against more grounded versions. A value-led version does not mean a cheaper brand voice. It means the customer can explain the purchase to herself without feeling reckless.
Move From Discount Reflex to Offer Testing
Discounting is the obvious lever, which is why it needs discipline. A below-60 sentiment read supports testing stronger offers, but it does not prove that margin should be given away across the board. The better first question is whether the consumer needs a lower price, lower perceived risk, or a higher-confidence bundle.
- Test a straight discount against a bundle that raises perceived utility.
- Test free shipping or returns against a price cut when purchase anxiety is the barrier.
- Test starter kits or smaller commitments for subscription, replenishment, and premium categories.
- Test warranty, trial, or guarantee language when the product is durable, expensive, or unfamiliar.
The durable-goods signal is a good example. A 20% month-over-month improvement in buying conditions for durables does not mean consumers are suddenly carefree.[4] It suggests some buyers may be willing to act if the offer makes the purchase feel timely and protected. For home goods, electronics, appliances, furniture, and other higher-ticket categories, that points toward total value, longevity, service, financing, and confidence-building proof rather than blanket urgency.
Make Payment Flexibility Visible Earlier
Inflation expectations are not abstract when someone is deciding whether to buy a sofa, replace a laptop, book travel, or commit to a higher-priced service. One-year inflation expectations eased to 4.2% in July from 4.6% in June, while long-run expectations held at 3.3%.[4] That is improvement, but it still leaves consumers watching cash flow.
Payment flexibility should not hide at checkout if it is part of the reason to buy. Installments, deposits, delayed billing, subscription pauses, and lower-commitment entry points can be tested in ad creative, product pages, landing pages, and lifecycle campaigns. The operational detail matters: a flexible-payment message that appears only after the customer has already hesitated is often too late to change the first judgment.
When Present Conditions Hold Up but Expectations Stay Weak
The June Conference Board split is one of the most useful Q3 planning signals because it explains why teams can see decent current demand and still feel resistance building. Present Situation at 116.4 says consumers were not describing the current environment as broken. Expectations at 74.4 says they were less comfortable with what comes next.[3]
That combination argues for shorter planning cycles. Not panic. Not weekly reinvention. Shorter cycles. A two-month campaign with fixed creative, fixed budget weights, and one offer logic is more exposed when the final July sentiment reading may diverge from the preliminary reading and when gasoline-price or geopolitical developments can change the consumer frame before the media plan is halfway done.
- Use shorter creative review windows for Q3 campaigns tied to discretionary spending.
- Hold back enough budget to shift between prospecting, retargeting, and lifecycle channels after each major sentiment release.
- Separate essential-benefit messages from upgrade messages in testing, instead of blending them into one vague value proposition.
- Give finance a threshold-based rationale for pacing changes before performance weakens enough to force cuts.
- Review final Michigan readings, not only preliminary headlines, before locking the next month’s creative posture.
This is also where channel posture changes. When expectations are weak, prospecting may need more proof and more conservative scale assumptions. Retargeting and lifecycle can carry more of the near-term conversion load because they speak to people already closer to action. Brand spend does not become irrelevant, but its message has to earn patience: durability, trust, stability, service, and usefulness usually deserve more room than broad optimism.
Use XLY/XLP and MER as Reality Checks, Not Oracles
Consumer sentiment indices measure attitudes. They do not measure actual spending. That distinction matters because marketers live in behavior: checkout completion, repeat purchase, average order value, paid social efficiency, retail sell-through, store visits, and subscription retention.
On TradingView, the XLY/XLP ratio gives a market-based complement: consumer discretionary versus consumer staples. If discretionary weakens relative to staples while sentiment is below 60, the category story becomes more cautious. If the ratio improves while sentiment remains depressed, it may indicate that markets are pricing a different spending path than surveys imply. Either way, it keeps the team from treating stated attitudes as the only truth.
The same caution applies to performance correlations. Common Thread Collective documented a 0.888 correlation between CCI and Marketing Efficiency Ratio across its DTC brand portfolio during 2020–2022, along with a 6.12% MER drop during low-sentiment periods.[7] That is a useful bridge from confidence data to media efficiency, especially for DTC teams that need a budget conversation grounded in something beyond platform volatility.
It is not a universal law. The same analysis noted that from March through September 2020, the CCI-MER correlation dropped to 0.054 as ecommerce decoupled from the broader economy.[7] The right use is comparative: if your MER is softening while sentiment remains in a rare low zone, the macro signal belongs in the diagnosis. It should not replace account-level analysis, incrementality work, creative fatigue checks, or attribution review.
A Practical Q3 Operating Position
For Q3 2026, the disciplined position is to treat below-60 sentiment as its own operating environment. That means value messaging gets more space, essential benefits move forward, flexible payment becomes more visible, and offer tests compare discounts with bundles, guarantees, smaller commitments, and risk reducers. It also means the July preliminary bounce is not enough to declare a broad consumer rebound.
TradingView is useful here because it makes the monitoring repeatable. Put FRED:UMCSENT, ECONOMICS:USCCI, XLY/XLP, release dates, and threshold alerts into the same workflow. Review the present-versus-expectations gap before locking campaign length. Check inflation expectations before leaning on big-ticket demand. Use MER and channel data as the behavior layer.
The marketing decision is not “be pessimistic.” It is to keep the plan adjustable until expectations recover enough to support longer commitments. In a quarter that began with sentiment still below 60, defensibility comes from matching campaign posture to the consumer’s actual confidence level, not from waiting for the clean recovery story everyone would rather present.
References
- University of Michigan Consumer Sentiment Index, TradingView, https://www.tradingview.com/symbols/FRED-UMCSENT/
- US Consumer Sentiment Improves for Second Straight Month, TradingView News, https://www.tradingview.com/news/te_news:567948:0-us-consumer-sentiment-improves-for-second-straight-month/
- Consumer Confidence, The Conference Board, https://www.conference-board.org/topics/consumer-confidence/
- United States Consumer Confidence, Trading Economics, https://tradingeconomics.com/united-states/consumer-confidence
- US Consumer Confidence Index, TradingView, https://www.tradingview.com/symbols/ECONOMICS-USCCI/
- Economic Calendar, TradingView, https://www.tradingview.com/economic-calendar/
- Consumer Confidence for DTC Business, Common Thread Collective, https://commonthreadco.com/blogs/coachs-corner/consumer-confidence-for-dtc-business

Comments
Join the discussion with an anonymous comment.