
Trade Desk's Q2 earnings signal a programmatic decoupling
The Trade Desk's Q2 2026 results — revenue up just 3% and a Q3 guide below consensus — cut against US programmatic forecasts that still call for double-digit growth. This numbers-first breakdown sets TTD's actuals against peer prints and neutral market forecasts to show that 2026 programmatic growth is concentrating in walled gardens, retail media, and direct/guaranteed deals — and what that means for channel-level budget allocation.
- Platform
- The Trade Desk
- Campaign type
- Open-internet DSP
- Spend range
- >$0M (TTD Q3 revenue guide)
- Timeframe
- Q0 2026 report; Q3 2026 guide
- Revenue growth
- +0% YoY to $715.057M
- Verdict
- mixed
- Last reviewed
- 0-08-26
The Trade Desk’s Q2 earnings landed in the middle of a still-bullish programmatic advertising outlook, and that is the useful part. On Aug. 6, 2026, TTD reported Q2 revenue of $715.057 million, up 3% year over year, with non-GAAP EPS of $0.34 and adjusted EBITDA of $241.279 million, or a 34% margin, down from 39% a year earlier.[1] StockStory put the revenue result about 4.9% below the $752.1 million consensus and noted that Q3 guidance of at least $650 million was well below the $804.8 million consensus.[2] That is not a mood shift. It is a dated miss against a dated expectation.
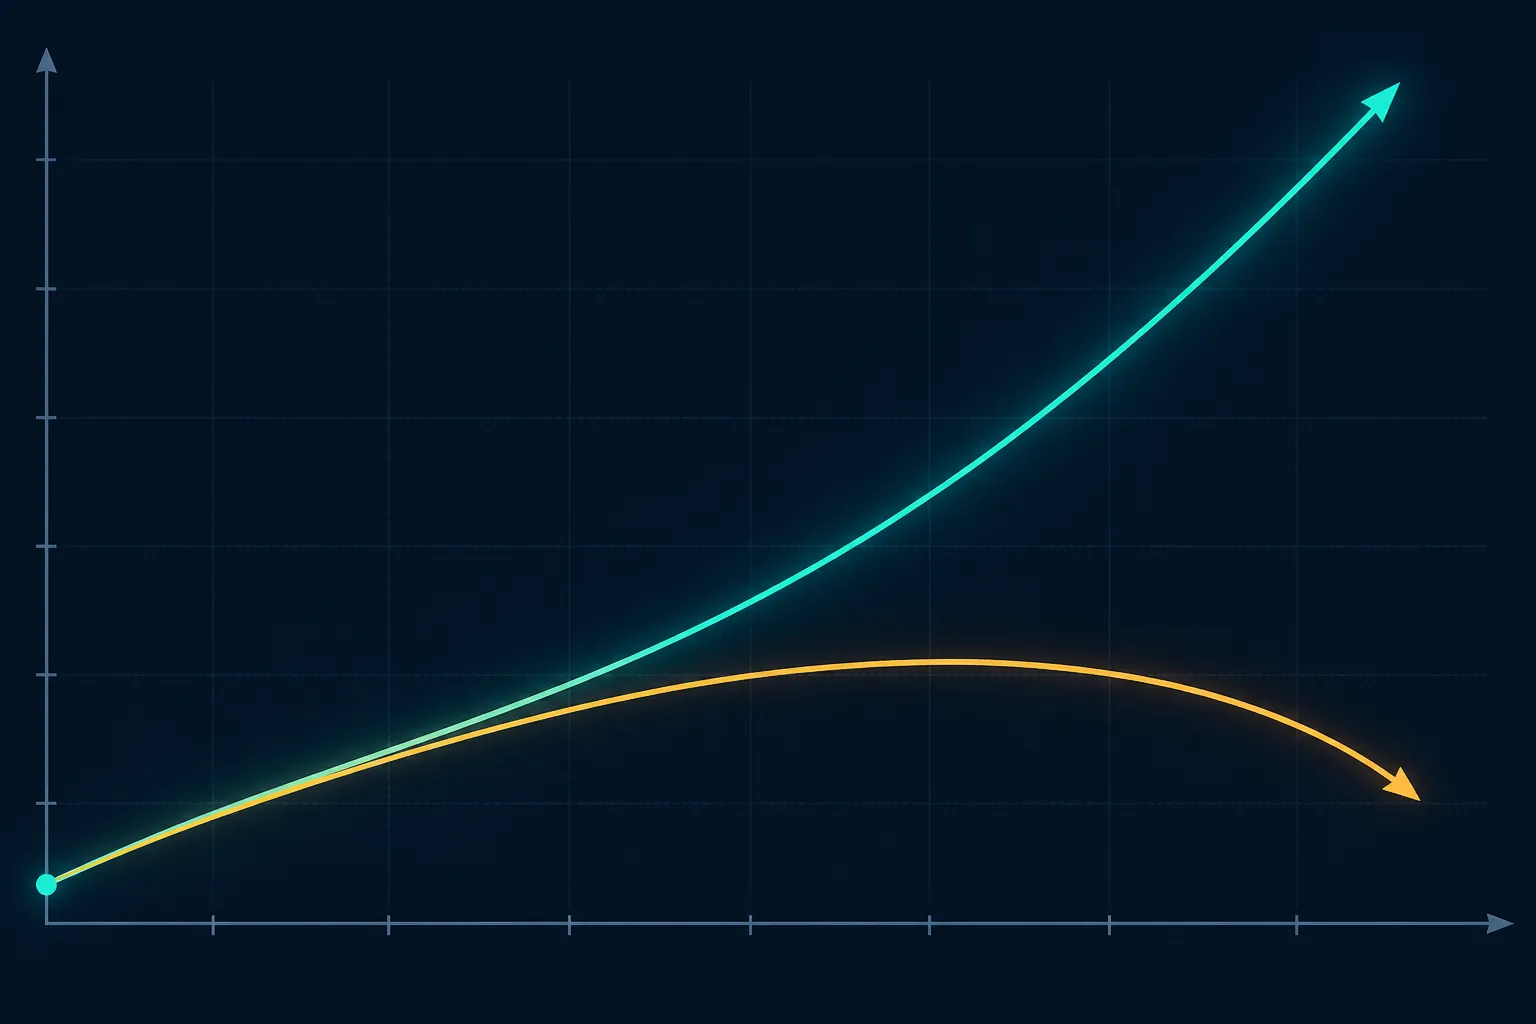
The uncomfortable comparison is that the market-level numbers did not crack at the same time. eMarketer’s H2 2026 forecast has US programmatic display exceeding $220 billion in 2026, up 17.4%, after $187 billion in 2025.[3] Basis cited the same $220 billion and 17.4% eMarketer figure in its 2026 programmatic trends work.[4] IAB’s January outlook forecast 9.5% growth in total US ad spend, with CTV up 13.8% and commerce media up 12.1%.[5] Dentsu projected global ad spend up 5.0% to $1.06 trillion in 2026.[6] The category forecast is still expanding; one of the best-known independent DSPs just printed something much flatter.
| Signal | Most relevant Q2 2026 number | What it measures |
|---|---|---|
| The Trade Desk revenue | $715.057M, +3% YoY [1] | TTD’s own platform revenue, not total programmatic market spend |
| The Trade Desk versus consensus | About 4.9% below $752.1M consensus; EPS $0.34 versus $0.40 consensus [2] | The gap between expected and reported near-term execution |
| The Trade Desk Q3 guide | At least $650M revenue versus $804.8M consensus [2] | Management’s next-quarter floor versus sell-side expectations |
| The Trade Desk margin pressure | Q3 adjusted EBITDA margin implied near 25% at the revenue floor; ex-SBC opex +12% YoY while revenue rose 3% [7] | Operating leverage, not just top-line demand |
| US programmatic display forecast | More than $220B in 2026, +17.4% YoY [3][4] | Market-wide programmatic display, including inventory pools beyond one independent DSP |
| US ad market outlook | Total US +9.5%; CTV +13.8%; commerce media +12.1% [5] | Broader ad demand and faster-growing subchannels |
| Global ad market outlook | Global +5.0% to $1.06T [6] | Macro ad spend, not open-web DSP health |
| Large platform ad prints | Meta ad revenue +27% to $59.4B; Amazon ads +26% to about $19.8B; Alphabet Search +17% to $63.3B [8] | Walled-garden, retail, and search demand |
| Programmatic-adjacent supply data | PubMatic said programmatic spend grew double digits and accelerated from April through June [9] | SSP-side programmatic flows, not a direct read-through to TTD |
| Commerce media data | Skai reported retail media plus paid social +26%, paid search +17%, and Amazon DSP spend +48% [10] | Commerce-media and retail-platform activation |
The miss was specific, not atmospheric
A buyer does not need an equity model to see why the Q2 print matters. Revenue grew 3% when the market was expecting more. Non-GAAP EPS came in below consensus. The Q3 revenue guide was not merely conservative by a rounding error; StockStory’s consensus comparison put it more than $150 million below the expected $804.8 million.[2] If a finance team asks why an open-internet DSP line should rise just because programmatic is growing, this is the first reconciliation problem.
The operating details make the gap harder to dismiss as timing. Trefis calculated that the Q3 adjusted EBITDA guide of about $160 million implies roughly a 25% adjusted EBITDA margin at the $650 million revenue floor, compared with the 34% margin TTD reported in Q2.[7] It also noted that ex-stock-based-compensation operating expenses rose 12% year over year to $504 million while revenue rose 3%, and tied part of the pressure to moving workloads from public cloud to owned data centers, turning a more variable bill into a more fixed one.[7]
That matters for media allocation because operating strain and spend visibility are different from a one-quarter narrative bruise. On the earnings call, CFO Laura Schenkein Olmstead said visibility was “somewhat more limited than in recent history.”[11] A buyer can respect a long-term platform argument and still treat that sentence as relevant to Q3 and Q4 budget release decisions.
The call did include healthier-looking internal signals. TTD said video was in the low 50s as a percentage of spend, mobile was in the high 20s, display was in the low double digits, and audio was about 7% and the fastest-growing channel for four straight quarters.[11] It also pointed to CTV growth of more than 50% year over year in EMEA and APAC, China up more than 100% year to date, 217 joint business plans, up 38% year over year, and retention above 95%.[11] Those are not irrelevant. They just do not erase the reported revenue growth, margin compression, consensus gap, or next-quarter guide.
A strong programmatic forecast is doing too much work
The phrase “programmatic outlook” is too blunt for 2026 planning unless someone says which pool of money they mean. Meta auction inventory, Amazon DSP, retail media, paid search automation, CTV programmatic guaranteed, publisher-direct fixed-price deals, and open-internet DSP bidding can all sit under or near the programmatic umbrella. They do not create the same budget case for TTD.
The eMarketer number is the cleanest example. US programmatic display above $220 billion and up 17.4% is a real market forecast.[3] But it is not the same as saying independent open-web DSP spend is up 17.4%, or that a given advertiser should raise its TTD budget by that amount. eMarketer’s earlier H1 2026 work also put programmatic direct at 76.3% of overall programmatic spend and 50.4% when excluding social, which means a large share of “programmatic” is already closer to automated direct buying than to open-exchange, high-decisioning DSP allocation.[12]
This is where the forecast and the earnings print can both be true. Programmatic can grow quickly in aggregate while the independent DSP line inside a media plan loses momentum, shifts toward lower-take-rate structures, or faces tighter scrutiny from buyers who now have retail, search, social, and CTV-direct alternatives with cleaner closed-loop reporting.

Where the growth is easier to see
The peer prints are useful mainly because they rule out the lazy explanation that ad demand simply disappeared. Meta’s ad revenue rose 27% to $59.4 billion, with impressions up 14% and price up 12%. Amazon advertising rose 26% to about $19.8 billion. Alphabet Search rose 17% to $63.3 billion.[8] Those are not open-internet DSP numbers, and that is precisely the point: demand was still flowing, but much of the visible growth was inside walled gardens, retail platforms, and search.
Commerce media data points in the same direction. Skai reported that retail media plus paid social spending rose 26% in Q2 2026 and paid search rose 17%.[10] Within Amazon Ads, Skai said Amazon DSP clicks rose 127%, CPC fell 35%, and spend rose 48%; during Prime Day, DSP share of Amazon Ads spend jumped from 17.9% to 25.5%.[10] That is programmatic-adjacent growth, but it is attached to Amazon’s retail signal and retail-media buying context, not a generic endorsement of every DSP budget.
PubMatic’s Q2 report also keeps the market-wide story from becoming too bearish. It said programmatic spend grew double digits and accelerated from April through June, with politics up 106% year over year and CTV up 4.1x between the Q2 2022 and Q2 2026 midterm cycles.[9] That supports the idea that some programmatic flows are healthy. It does not prove that all independent ad-tech businesses are receiving the same spend pattern, or that buy-side open-internet budgets should be increased without channel-level evidence.
TTD’s own framing explains the pressure, but it does not settle the budget question
Jeff Green’s explanation deserves space because it identifies the shift TTD wants buyers and investors to notice. On the Q2 call, he described some brands choosing “low-cost, low decisioning” programmatic guaranteed or fixed-price buying, and he characterized some “agentic wrappers” as the “ad networks of 2006.”[11] The argument is that automated buying that simply wraps inventory or executes guaranteed deals is not the same as TTD’s higher-decisioning, objective-driven model.
That framing is plausible as a product argument. It is weaker as a budget override. If a buyer is moving money into a retail-media DSP because transaction signals are closer to sales, or into CTV guaranteed because supply access and brand safety are easier to defend, the fact that those dollars are “lower decisioning” does not automatically make them bad dollars. It may mean the buyer values certainty, measurement, or procurement simplicity more than the optionality of open-internet decisioning in that moment.
This is the part of the 2026 programmatic outlook that gets lost when the category is discussed as one rising line. A market can become more automated and more concentrated at the same time. A brand can increase programmatic exposure while decreasing reliance on an independent open-web DSP. A CTV budget can be programmatic in workflow but direct or guaranteed in commercial shape. A retail-media budget can use DSP mechanics while remaining anchored to a retailer’s data, inventory, and attribution environment.
What buyers should separate before adding dollars
The practical move is to stop letting “programmatic” sit as one expandable line in the plan. At minimum, the budget should separate open-internet DSP buying, retail-media DSP buying, social auction buying, search automation, CTV programmatic guaranteed, publisher-direct programmatic direct, and open exchange or curated marketplace buying. Those lines have different inventory access, data rights, fee loads, measurement paths, and finance explanations.
- If the proposed increase is for open-internet DSP spend, ask for platform-level spend, conversion, reach, frequency, supply-path, and incrementality evidence from the current buying window—not a market forecast.
- If the increase is for CTV, separate auction-based buying from programmatic guaranteed or fixed-price publisher/platform deals. The workflow may be programmatic while the decision logic is closer to direct.
- If the increase is for retail or commerce media, judge it against retail signal quality, closed-loop reporting, audience match, margin impact, and whether the spend is incremental to search and social.
- If a vendor argues that broad programmatic growth supports its budget, require the bridge: which forecast pool, which inventory type, which platform, which deal type, and which dated performance data connect the forecast to that line item?
The burden of proof is higher for automatic increases. TTD’s Q2 result does not say the open internet is uninvestable. It does say that broad programmatic growth no longer gives an independent DSP a free pass in the budget meeting. The same plan can raise retail media, hold open-web prospecting flat, shift CTV into guaranteed structures, and test curated supply without contradicting the market outlook.

The allocation read
For 2026 planning, the safest read is decoupling. TTD’s Q2 earnings and Q3 guide do not prove a broad programmatic advertising slowdown. They show that growth is unevenly distributed across walled gardens, retail media, commerce media, CTV direct or guaranteed structures, and the independent open-internet DSP channel.
That makes the next dollar a channel-level decision. Open-internet DSP expansion should be earned with named, dated performance evidence from the buyer’s own platform and deal mix. A $220 billion programmatic forecast is a market backdrop; it is not, by itself, a budget authorization.
References
- The Trade Desk Reports Second Quarter 2026 Financial Results — The Trade Desk, August 6, 2026
- The Trade Desk (NASDAQ:TTD) Reports Sales Below Analyst Estimates In Q2 CY2026 Earnings, Stock Drops 21.8% — StockStory
- US Programmatic Advertising Forecast & Ad Tech Trends H2 2026 — eMarketer, July 17, 2026
- 7 Programmatic Advertising Trends Shaping 2026 — Basis, June 9, 2026
- Outlook Study Forecasts 9.5% Growth in U.S. Ad Spend — IAB, January 28, 2026
- Ad spend growth is projected to slow to 5 percent in 2026, still outpacing economic growth — Dentsu, May 27, 2026
- The Trade Desk Took Its Workloads In-House. Then The Margin Guide Cracked. — Trefis, August 11, 2026
- Peer Q2 2026 advertising prints — Marketing Dive, July 30, 2026
- Quarterly Global Advertising Spend Trends Q2 2026 — PubMatic
- Ad Spend Rises Across Every Channel in Q2 2026 as AI Reshapes Commerce Media, Skai Data Shows — Skai, July 28, 2026
- Trade Desk (TTD) Q2 2026 Earnings Call Transcript — The Motley Fool, August 13, 2026
- Programmatic Advertising Forecast & Trends H1 2026 — eMarketer, January 27, 2026
Built on this evidence
No Bidding tactic or Creative record currently cites this case file. Compare it against other results in Benchmarks.
Related benchmark reading
Report a corroborating or contradicting result
Seeing something different in your own account? Feed the data-integrity loop instead of leaving an open comment.