
Before You Trust AI Creative Claims, Check Share a Coke
The famous Share a Coke numbers — US +2% sales, Australia +7% young-adult consumption, +11% participating-package sales — trace to different sources, scopes, and methods, mostly Ogilvy estimates and company statements rather than independent measurement. Tracing each figure to its dated origin gives media buyers a reusable checklist for auditing AI-personalized creative lift claims.
- Platform
- Cross-platform
- Creative type
- AI personalized creative
- Failure type
- missing test-design disclosure
- Last reviewed
- 0-08-26
The number usually appears around slide seven. An AI creative vendor has shown a few sample ad variations, maybe a personalization flow, and then the Coca-Cola Share a Coke personalized bottles advertising campaign arrives as the safe proof point: names on bottles, social sharing, sales up. Sometimes the lift is 2%. Sometimes it is 7%. Sometimes it is 11%. In weaker retellings, it has somehow become 20%.
Share a Coke deserves better than that. It was a sharp campaign because the personalization was not just decoration; it changed shopping behavior, gifting behavior, and posting behavior. But the famous performance figures do not come from one clean, independent measurement. They come from different markets, different denominators, different sources, and different degrees of disclosure.
The Share a Coke numbers do not measure the same thing
Before using Share a Coke as proof that personalization lifts sales, separate the figures that usually get compressed into one story.
| Figure often cited | Market and scope | What it measured | Source trail | Caveat |
|---|---|---|---|---|
| +7% | Australia, 2011 launch | Young-adult consumption | Ogilvy estimate, aggregated by Wikipedia and corroborated by The Guardian [1][2] | Not an independent public lift study; not a universal sales benchmark |
| +4% | Australia, 2011 launch | Category share | Ogilvy estimate, aggregated by Wikipedia and corroborated by The Guardian [1][2] | Same provenance issue; different metric from consumption or revenue |
| +2% | United States, 2014 campaign | Overall sales increase | Company-statement-based figure summarized by Wikipedia, with paywalled WSJ coverage noted there [1] | Not package-specific and not a disclosed randomized incrementality test |
| +11% | United States campaign | Sales of participating packages | WARC case entry [3] | Narrower denominator than total Coca-Cola sales |
| 1.25 million | United States campaign | Additional teens trying Coke | WARC case entry [3] | Trial is not the same as retained buyers, revenue, or ROAS |
| 18.3 million+ media impressions; +870% Facebook traffic; 500,000+ #ShareACoke images; 25 million new Facebook followers | Campaign social and earned-media effects | Attention, participation, and social activity | Aggregated by Wikipedia [1] | Useful evidence of cultural participation; not sales proof by itself |
| 20% | Unclear | Usually retold as sales lift | Social/video retellings without a stable original source in the available materials | Do not treat as a verified Share a Coke result |
The problem is not that one number is “right” and the rest are “wrong.” The problem is that they answer different questions. Young-adult consumption in Australia, participating-package sales in the U.S., overall U.S. sales, and hashtagged images are not interchangeable measures. Once those figures are repeated as one generic personalization lift, the case study stops being evidence and starts being decoration.
Australia: the famous +7% is an Ogilvy estimate
The Australian launch is where the campaign mythology is strongest, and for good reason. It is also where the measurement language needs to stay narrow. The commonly cited Australian results are a 7% increase in young-adult consumption and a 4% gain in category share, attributed to Ogilvy estimates in the available secondary trail [1][2].
That makes the figures useful, but not clean in the way a media buyer usually means clean. They are not described in the public material as independently measured incrementality results with a visible holdout. They are also Australian launch results, not a standing global conversion rate for personalized packaging.
This distinction matters because the Australian result is often used as if it were a general claim about personalization. A better reading is more specific: in one launch market, a highly visible packaging mechanic, backed by distribution and media, was estimated by the agency to have increased young-adult consumption and category share.
The U.S. +2% sales figure is broader, not cleaner
The U.S. number usually enters the deck as “sales rose 2%.” Wikipedia summarizes the 2014 U.S. campaign as producing a sales increase of more than 2%, based on company statements and coverage that includes a paywalled Wall Street Journal article; it also says the campaign was credited with reversing a long-running decline in U.S. Coke consumption [1].
There are two separate issues here. First, the source trail is company-statement-based rather than an independently published test design. Second, total sales are a broad outcome. They can include effects from media spend, retail distribution, seasonality, pricing, promotional pressure, and the packaging idea itself. A total-sales increase may be exactly what a CMO cares about, but it is not automatically a transferable estimate of what a personalization module will do inside a paid social account.
+11% participating-package sales is a different denominator
WARC’s U.S. case entry gives another frequently cited number: sales of participating packages rose 11%, and 1.25 million more teens tried Coke [3]. Those are stronger for understanding the campaign’s retail behavior than a vague “people loved it” recap, but they still need their labels attached.
Participating-package sales are not total brand sales. Teen trial is not repeat purchase. Neither is ad ROAS. These measures are valuable because they are closer to the actual mechanism—people looking for named packages and buying them—but they cannot be swapped into a sentence about overall sales lift without changing the claim.
Earned media explains the spread, not the sales lift
The social numbers are the easiest to overuse because they sound huge: more than 18.3 million media impressions, an 870% increase in Facebook traffic, more than 500,000 #ShareACoke images, and 25 million new Facebook followers are all part of the commonly cited campaign trail [1].
Those numbers help explain why the campaign traveled. They do not prove that every personalized impression caused an incremental sale. If the claim is “the campaign generated participation,” the social metrics belong in the evidence. If the claim is “personalization lifted revenue by X%,” they are supporting context, not the measurement.
The unverified 20% version is what number drift looks like
The 20% version is the easiest one to handle: do not use it as a Share a Coke performance result. In the available material, it does not trace back to a stable dated source with a market, metric, method, and owner. It appears as a social or video retelling, which is exactly how case-study numbers decay: a real campaign, several real figures, one simplified performance story, and then a larger unsourced number that sounds close enough to the legend.
A good audit does not need to prove the 20% claim false. It only needs to refuse the burden shift. If the number cannot be sourced, it cannot carry budget.
What the bottle mechanic actually did
The campaign itself was not vague personalization. Coca-Cola’s own history page describes the Australian start: 150 popular names were printed on bottles and cans, enough to reach about 42% of the population, and 250 million named bottles and cans were sold that summer [4].
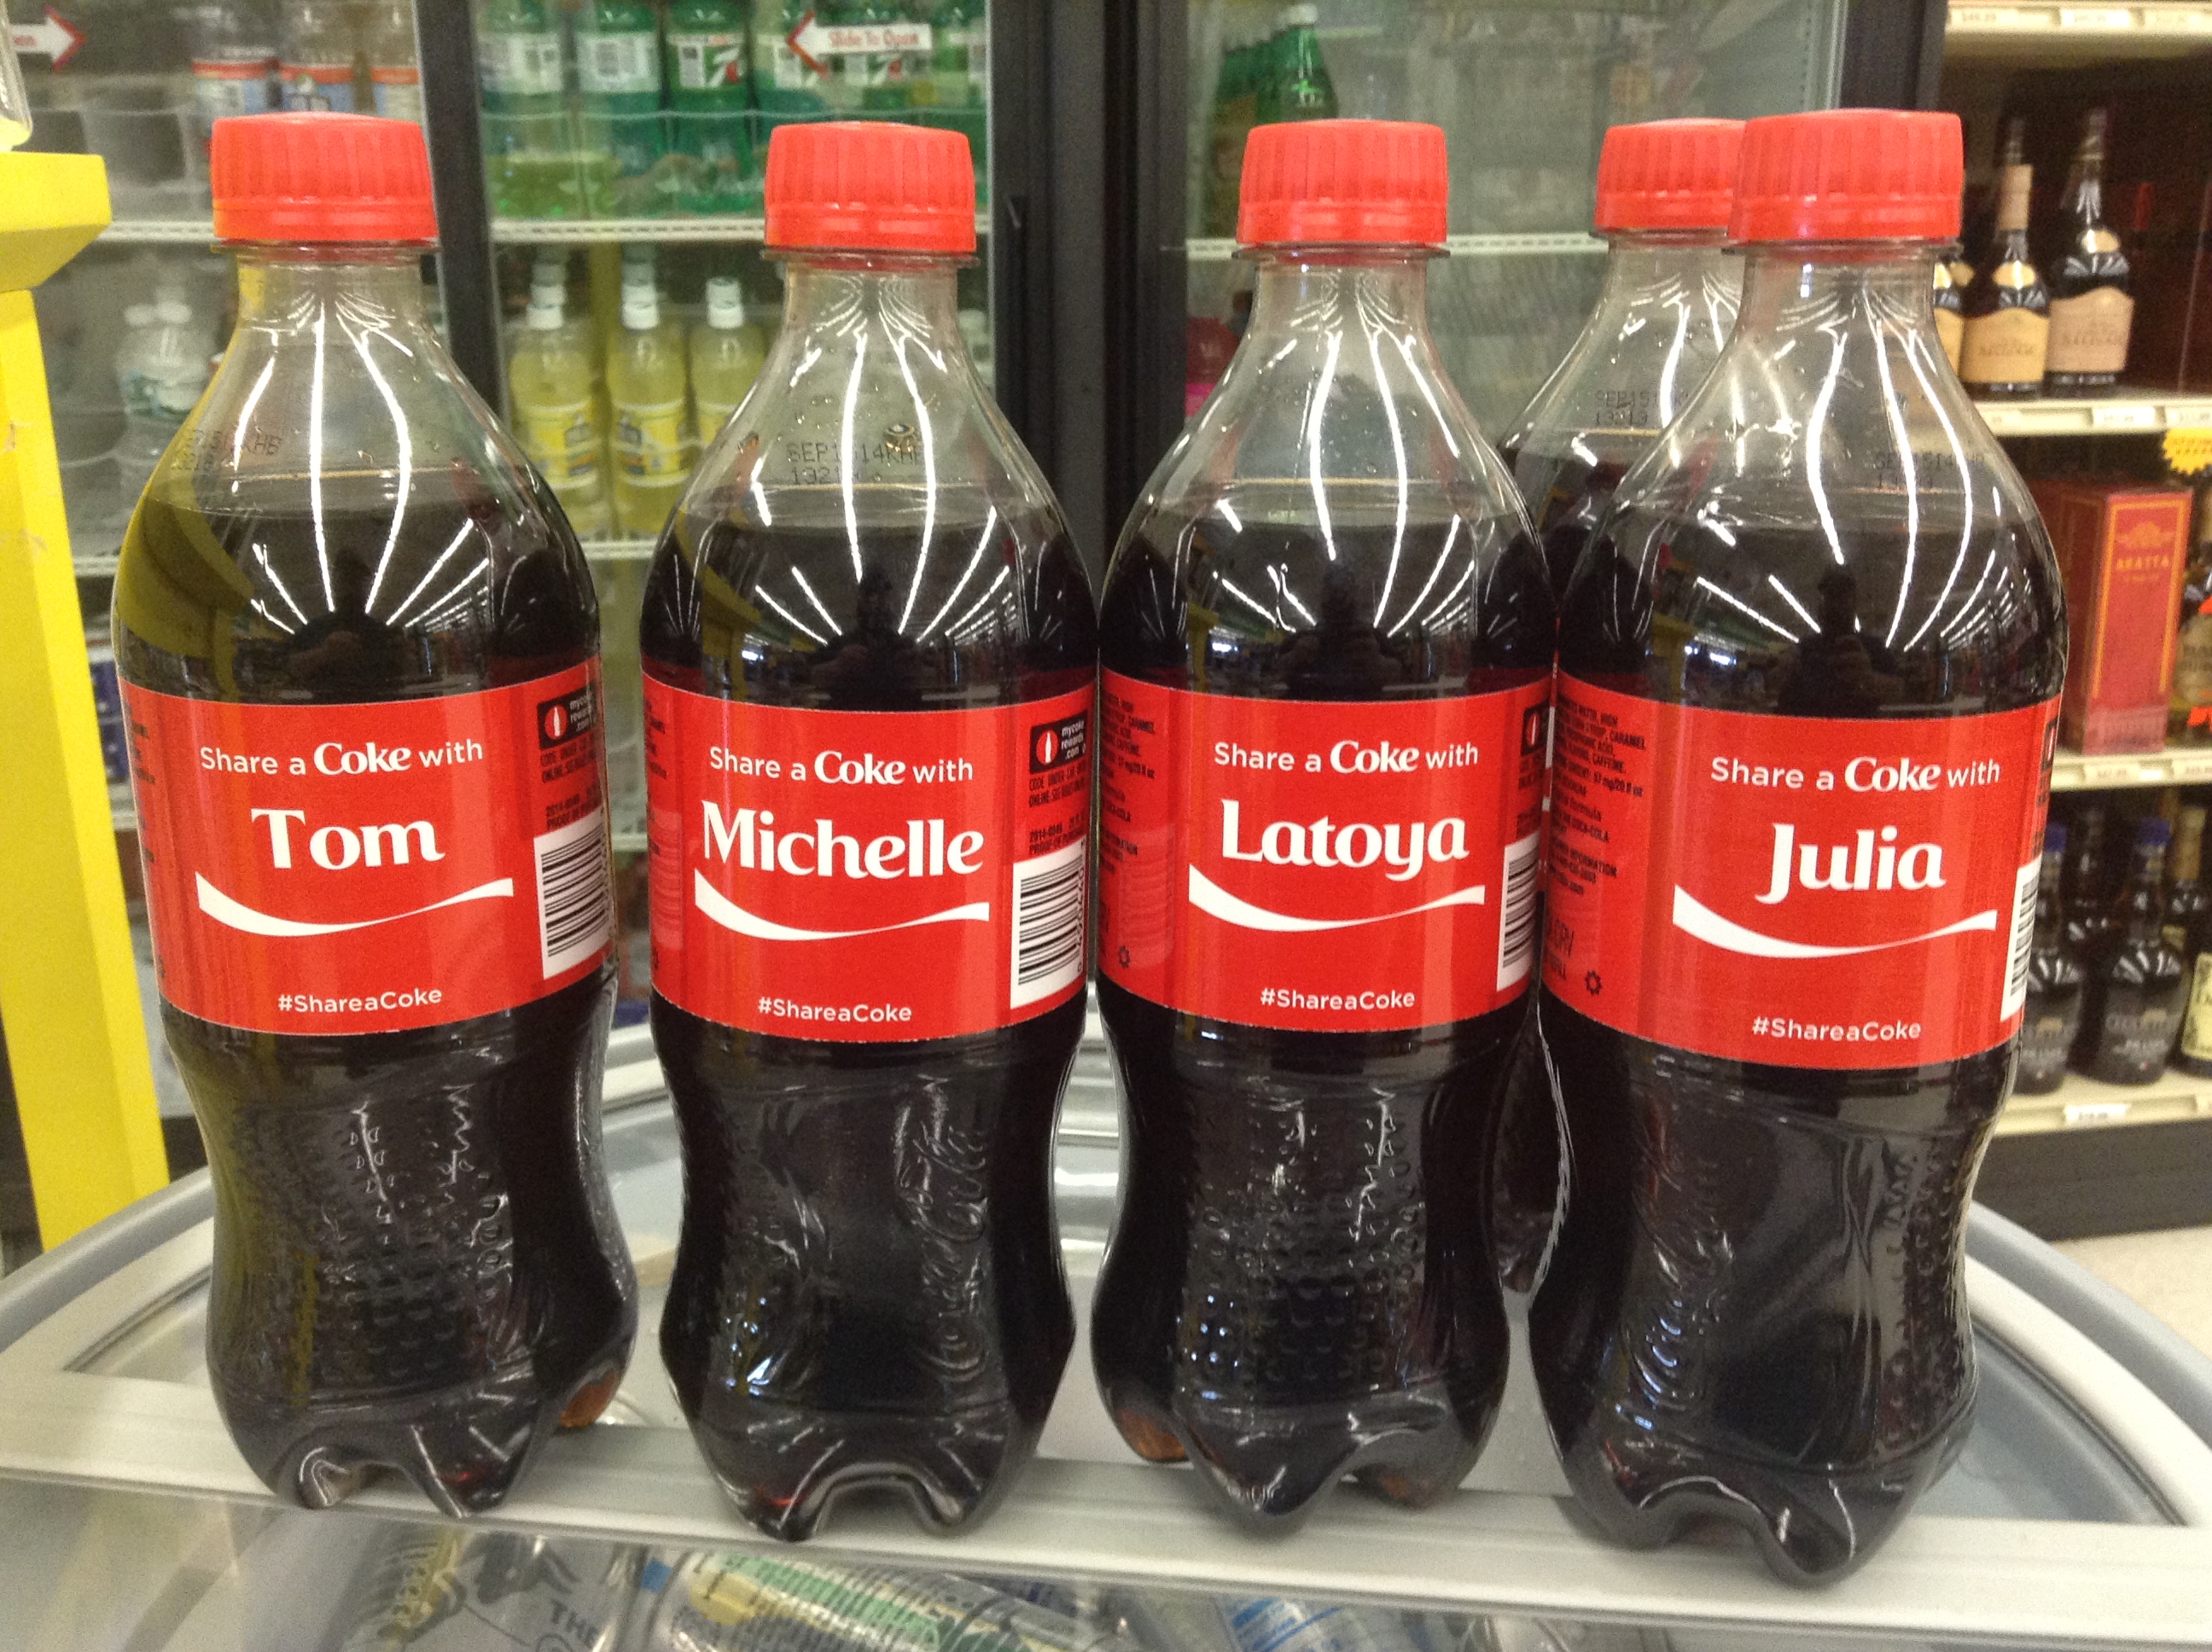
The clever part was the social instruction embedded in the product. Coca-Cola’s history of the campaign emphasizes that most people would not find their own name, so the behavior shifted toward finding someone else’s name and sharing it with that person [4]. That is a very different mechanism from a first-name merge tag in an email subject line. The name turned a stocked package into a hunt, a gift, a social object, and a reason to post.
There is a small naming-scale wrinkle worth keeping straight. Coca-Cola’s history page says the Australian launch used 150 names [4]. Wikipedia describes the broader campaign approach as using 250 of the most popular names in each market [1]. Those statements can coexist: the original Australian execution and later market playbooks were not necessarily identical. The practical point is that the execution had real operational boundaries. It was personalization at mass-retail scale, not infinite one-to-one production.
The 2025 relaunch keeps the pattern alive, without a new performance readout
Coca-Cola brought Share a Coke back in 2025 for a new generation, with a rollout across more than 120 countries, a QR-led digital hub, and a “Memory Maker” experience that lets people create personalized videos [5]. Marketing Dive covered the refresh as a Gen Z-facing update with digital experiences layered onto the named-package idea [6].
The public relaunch material is useful for understanding strategy, not for claiming a fresh campaign lift. Marketing Dive’s coverage includes broader company context, including more than $40 billion in Coca-Cola Trademark retail sales over three years and 14% organic revenue growth in Q4 2024 [6]. Those are brand-level financials. They are not published campaign-level performance metrics for the 2025 Share a Coke relaunch.
That absence should not be read as failure. It should be read as absence. If no campaign-level result is published, the relaunch can support a point about Coca-Cola continuing to invest in the mechanic. It cannot support a claim that the refreshed campaign lifted sales by a specific amount.
How this maps to AI-personalized creative claims
Share a Coke and AI-generated ad creative are not the same technology, channel, or operating model. The useful comparison is narrower: both are easy to flatten into a personalization-wins story unless the lift number is tied back to source, market, metric, method, and holdout.

McKinsey’s personalization statistics are a good example of where the line sits. Its research says 71% of consumers expect companies to deliver personalized interactions and 76% get frustrated when that does not happen [7]. That is evidence of consumer expectation and irritation. It is not evidence that an AI creative tool will improve paid-media ROAS in a specific account.
The same caution applies to vendor case-study language. Hunch Ads publishes dynamic creative optimization case-study material [8], and the broader category includes attractive self-reported claims from vendors such as Zeely and Omneky. The issue is not that vendor claims are automatically useless. The issue is that a lift number without disclosed test design is a lead, not a benchmark.
For paid media, the minimum audit is not complicated. It is just often skipped.
- Source: who measured the result — the brand, agency, platform, vendor, publisher, or an independent analyst?
- Date: when did the test run, and does that period still resemble the current auction, account structure, and creative environment?
- Market: which country, audience, product line, placement, or campaign type does the number describe?
- Metric: is the claim about CTR, engagement, package sales, total sales, trial, conversion rate, revenue, profit, or ROAS?
- Method: was it a randomized lift test, geo test, platform experiment, pre/post comparison, model estimate, or post-campaign case-study calculation?
- Holdout: was there a comparable group that did not receive the AI-personalized creative?
- Variable isolation: was AI creative the thing being tested, or was it bundled with new targeting, new budget, new placements, new bidding, and new offer strategy?
- Denominator: does the percentage apply to all sales, participating SKUs, one audience segment, one channel, or one creative subset?
This is the same discipline that matters when separating a brand-reported production claim from a performance claim, as in AI creative audits of Dr Pepper Fansville, or when setting up a holdout so AI-generated assets are not credited for every default-on platform enhancement, as in this AI ad creative testing protocol.
The budget standard should be higher than the keynote standard
A keynote can survive with a compressed story: Coca-Cola put names on bottles and sales improved. A media plan cannot. Once money is moving, “personalization works” is not a measurement standard.
Share a Coke remains a brilliant personalization campaign because the object did work in culture and in distribution. People searched, bought for other people, shared photos, and turned packaging into media. The recycled numbers are the weaker part of the story.
If a buyer would not accept “+7%,” “+11%,” or “2–5x CTR” without knowing the source, market, metric, method, and holdout, the same standard should apply before trusting any AI creative lift claim.
References
- Share a Coke — Wikipedia
- What the Share a Coke campaign can teach other brands — The Guardian, July 24, 2013
- Coca-Cola: Share a Coke US — WARC
- How a Groundbreaking Campaign Got Its Start Down Under — The Coca-Cola Company
- Iconic “Share a Coke” Is Back for a New Generation — The Coca-Cola Company
- Coca-Cola refreshes ‘Share a Coke’ for Gen Z with digital experiences — Marketing Dive
- The next frontier of personalized marketing — McKinsey
- Dynamic Creative Optimization Case Study — Hunch Ads
This is a record of what happened and what was tested, not legal advice. Compliance determinations require qualified counsel.