
World Cup 2026 Changed Algorithms, Brand Safety and Paid Ads
A dated, phase-by-phase evidence record of what the 2026 World Cup changed in social algorithms, brand-safety systems, and paid media. It separates documented effects — $1.42B in in-game spend, 7M+ harmful posts flagged — from auction-level claims that still lack verifiable data.
- Platform
- Cross-platform
- Change category
- policy
- Effective date
- 0-06-11
- Change type
- policy shift
- Impact level
- medium
Evidence record reviewed August 28, 2026: the FIFA World Cup ran from June 11 through July 19, ending with Spain’s 1–0 win over Argentina at MetLife Stadium. Three figures set the boundaries of the review:
- $1.42 billion in in-game TV, cable, and streaming media — not paid-social spend. [1]
- More than 7 million harmful posts flagged by FIFA’s Social Media Protection Service, roughly 14 times the 470,000 reported for Qatar 2022. [2]
- Creator-view evidence at billion-scale, alongside FIFA’s preferred-platform arrangement with TikTok, supports treating the creator layer as the tournament’s effective primary broadcast. [3]
Those figures describe different systems. The first measures in-game media buying across broadcast and streaming. The second measures moderation activity. The third concerns distribution and audience behavior. They should not be collapsed into a claim that social CPMs rose, that paid-social ROAS fell, or that an algorithm caused a particular commercial result. The record supports a change in how the event was distributed and policed. It does not supply a verified tournament-level account of social auction economics.

The phase ledger
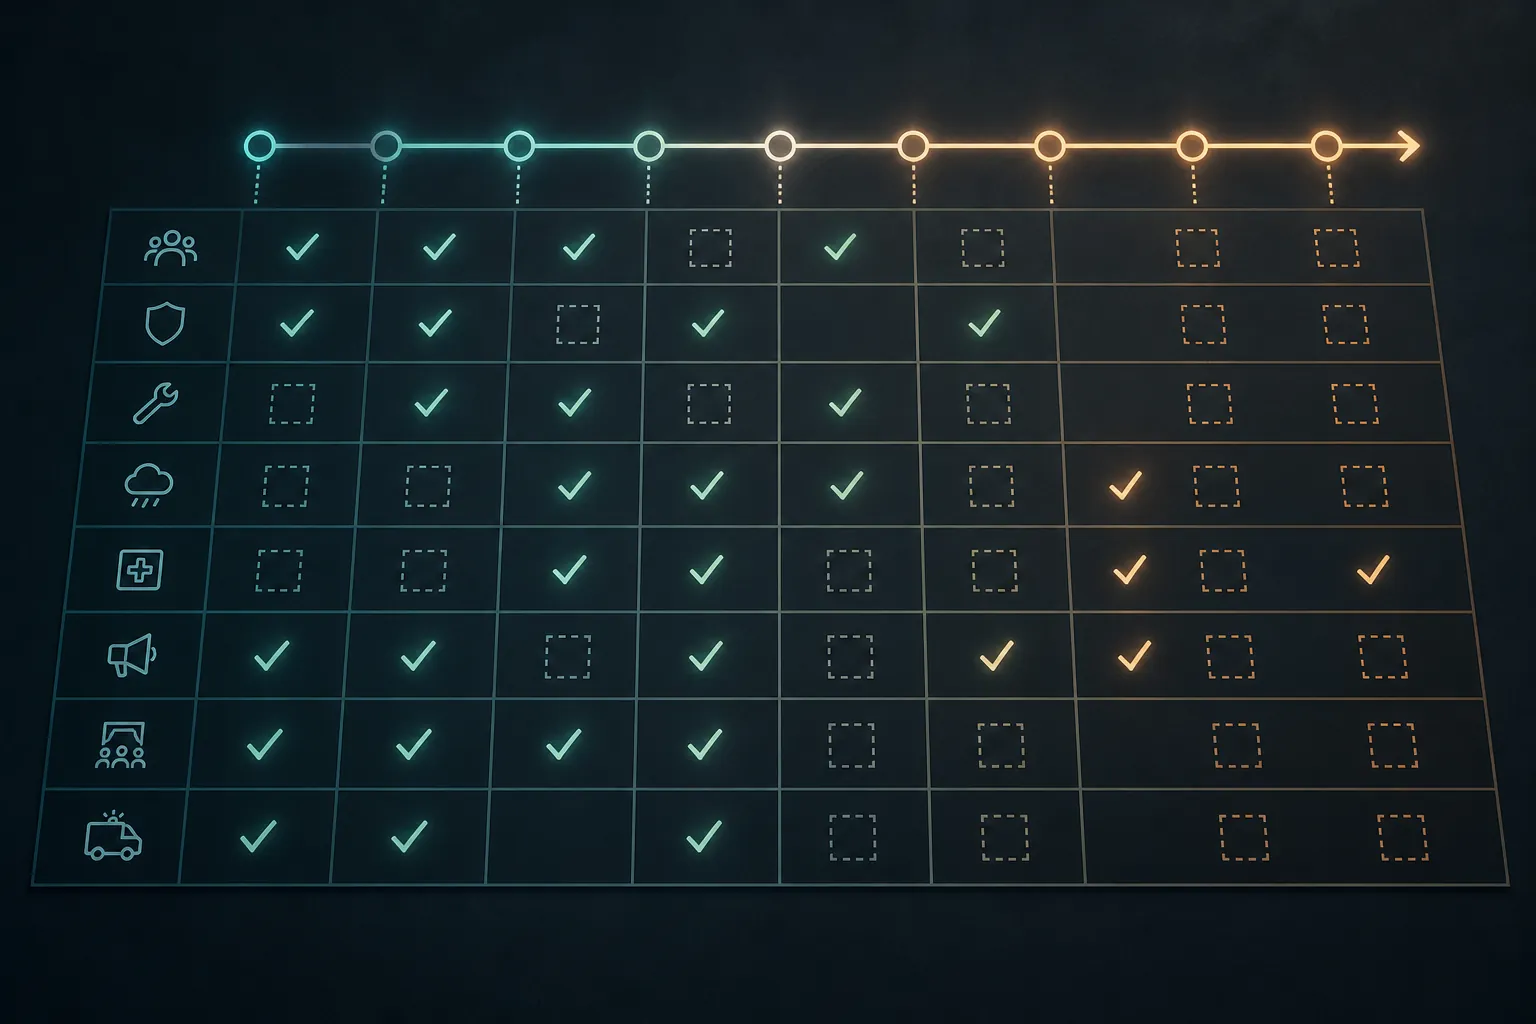
A useful way to review the tournament is to keep three columns separate: what platforms distributed, what safety systems detected or acted on, and what paid media actually measured. The ledger below leaves weak cells unresolved instead of filling them with plausible auction narratives.
| Phase and date | Algorithm or platform event | Safety record | Paid-media observation |
|---|---|---|---|
| Pre-tournament — before June 11 | GWI forecast that 74% of sports fans would follow or watch sports via social, 61% would consume highlights or clips, and 70% would follow athletes or teams. These were expectations, not post-event outcomes. [4] | Brand-safety planning included blocklists and keyword controls. Reporting later documented terms such as “Latino” and “immigrant” appearing on legacy blocklists, indicating potential overblocking. [5] | No pre-tournament forecast in the record establishes how Advantage+, Performance Max, or Smart+ auction prices would move. |
| Group stage — June 11 onward | TikTok operated as FIFA’s first-ever preferred platform, with creator correspondents helping move match-adjacent coverage through creator feeds. Creator viewing became part of the event’s broadcast layer. [3] | FIFA’s self-reported moderation system processed more than 53 million posts and comments during the tournament period; more than 7 million were flagged as harmful. [2] | MediaRadar recorded in-game media across the full tournament window, but its figure covers TV, cable, and streaming rather than paid social. [1] |
| Knockouts — July | IShowSpeed’s streams passed 1 billion views, including 48 million views for the final stream, while creator content accumulated more than 2.5 billion YouTube views. These view totals indicate distribution scale, not paid reach or attributable sales. [3] | FIFA reported more than 200,000 abusive posts actioned, more than 15,000 escalations, and over 1,000 egregious threats referred to authorities. [2] | The documented paid-media total remained the $1.42 billion in-game figure. No usable tournament-level social CPM, ROAS, or auction-shift series was located. |
| Final — July 19 | The creator layer had become a parallel route to live-event attention rather than merely a promotional add-on. The available evidence measures views and participation, not a causal change in recommendation ranking. | FIFA reported that more than 500,000 AI-detected messages were reviewed by humans. The scale is material, but the figures are FIFA’s own reporting rather than an independently audited measurement. [2] | Of the $1.42 billion in-game total, 90.0% — $1.28 billion — was broadcast and 10.0% — $141.5 million — was streaming. Official sponsors accounted for 24.8%, while non-sponsors accounted for 75.2%. [1] |
| August aftermath — August 5–28 | Hope Not Hate’s analysis, reported by the BBC on August 20, found that X’s recommender system pushed racist abuse targeting England players into recommendation feeds. The analysis covered more than 300,000 X posts and identified more than 5,500 explicitly racist posts; it is advocacy research, not a platform-wide causal audit. [6] | The post-tournament evidence made the recommendation problem visible after the final: harmful material could be both detected and redistributed before or alongside enforcement. [6] | Brand reports showed mixed commercial evidence: admitted underperformance, volume growth and first-party-data gains, delayed payback, and large creator deployments. None isolates a social-auction effect. [7] |
The creator feed became the place many people experienced the tournament
The most defensible distribution judgment is not that traditional broadcasting disappeared. MediaRadar’s figures show the opposite: broadcast accounted for the overwhelming majority of measured in-game media. The change was that creator distribution supplied a second, highly visible layer around the broadcast and increasingly carried the social experience of the tournament.
TikTok’s status as FIFA’s first preferred platform, its 30 creator correspondents, IShowSpeed’s reported billion-plus stream views, and more than 2.5 billion YouTube creator-content views point in the same direction. The match was no longer the only unit being distributed. Reactions, access, watch-alongs, interviews, fan explanations, and creator personalities were each competing for recommendation and repeat viewing.

The creator-campaign data is also more useful when its metric is left intact. BeInfluence reported $48.9 million in earned media value for Adidas from approximately 3,000 creators and 6,700 posts, and $11.5 million in EMV for Michelob Ultra from 346 creators and 947 posts. [3] EMV can describe the estimated value assigned to exposure. It is not revenue, incremental profit, or proof that a platform auction became more expensive.
Safety systems were operating at a different scale—and still had a recommendation problem
FIFA said its protection service moderated more than 53 million posts and comments, flagged more than 7 million as harmful, actioned more than 200,000 abusive posts, escalated more than 15,000 cases, and referred more than 1,000 egregious threats to authorities. More than 500,000 AI-detected messages were reviewed by humans. [2] Compared with FIFA’s reported 470,000 harmful posts flagged during Qatar 2022, the change in flagged volume was roughly fourteenfold. [2]

The qualification should stay attached to every one of those numbers: FIFA reported them about its own service. They are important operational evidence, not an independent census of all abuse across every platform. The figures also combine different actions—flagging, moderation, human review, escalation, and referral—so they should not be treated as interchangeable measures of prevalence.
The August reporting adds the missing distribution question. Hope Not Hate analyzed more than 300,000 X posts and identified more than 5,500 explicitly racist posts targeting England players. BBC Sport reported that X’s recommender algorithm pushed abuse into recommendation feeds, with Jude Bellingham the most targeted player. [6] Hope Not Hate’s advocacy role and methodology matter here: the finding is evidence of observed amplification in the analyzed material, not proof that every abusive post received algorithmic promotion or that the recommendation system alone caused the abuse.
For a brand-safety operator, detection and distribution are therefore two separate timestamps. A post may be identified, queued for review, actioned, or referred only after it has already been recommended, copied, screenshotted, or placed beside a brand’s message. A high moderation count can coexist with exposure to harmful content; it does not demonstrate that the protection system prevented that exposure.
The documented-versus-undocumented boundary
The record supports several observations about social distribution and safety. It does not support a numerical claim about what happened inside the paid auctions. Searches for usable tournament-level evidence on CPM, ROAS, or auction shifts in Advantage+, Performance Max, and Smart+ campaigns produced no verifiable dataset.
| Documented | Not yet documented |
|---|---|
| Creator distribution reached billion-scale reported views; TikTok received FIFA’s preferred-platform status; FIFA reported a fourteenfold increase in harmful posts flagged versus Qatar 2022; X recommendation amplification was reported in an analyzed set of racist posts; MediaRadar measured $1.42 billion in in-game TV, cable, and streaming media. | A tournament-wide change in paid-social CPM; a platform-specific change in auction competition; a causal link between harmful-content amplification and CPM or ROAS; verified Advantage+, Performance Max, or Smart+ performance shifts; an aggregate social ROAS for the event. |
The $1.42 billion number is especially easy to misuse. It covers 164,395 in-game occurrences from June 11 through July 19, across 6,737 brands, with $1.28 billion in broadcast and $141.5 million in streaming. [1] It is a large paid-media environment, but it is not a social-ad-spend total. Moving it into a social performance argument would turn a useful measure into the wrong measure.
The same discipline applies to brand outcomes. An observed feed effect is not an auction result, and EMV is not sales. Even a brand’s own performance report may contain multiple simultaneous causes—creative, offer, distribution, retail conditions, market timing, and media mix—so an admission of underperformance is commercially meaningful without isolating every variable.
Paid media supplied a reality check, not a single winner’s story
The August brand reporting is more revealing than a victory list because the outcomes do not line up neatly. McDonald’s CFO Ian Borden attributed roughly one-third of the company’s second-quarter traffic underperformance to an underperforming FIFA campaign. Coca-Cola reported 5% second-quarter trademark Coke volume growth, its strongest growth in 17 years excluding the COVID period, alongside more than 25 million first-party data points. Adidas added €212 million in marketing spend during a record quarter of roughly €6.7 billion, while its CEO said the investment did not have a payback in commerciality in the same period. Unilever deployed more than 50,000 creators across 35 brands. [7]
These are different kinds of evidence: an executive attribution, a volume result and data-collection count, a delayed-payback statement, and a deployment scale. They cannot be placed on one scoreboard without losing their meaning. Together, they show why tentpole review needs account-level definitions of success before the event begins.
The evidence also does not justify importing unverifiable campaign ROAS figures into the record. A reported purchase count, CPA, or return multiple is only useful here if its source and methodology can be reviewed. The available material does not clear that bar for the paywalled figures excluded from this review.
What carries into the next tentpole
The World Cup leaves two strong records and one conspicuous gap. The creator layer functioned as a primary route to attention around the tournament, and safety infrastructure operated at a materially larger flagged-post scale than in 2022. The in-game media environment reached $1.42 billion by MediaRadar’s measure. What remains unproven is the effect on social auctions.
For the next event, the practical carryover is a dated, source-audited risk record. Keep platform distribution observations separate from moderation actions. Keep paid-media expenditure separate from paid-social delivery. Keep creator views and EMV separate from revenue. Log when content was published, when it was recommended, when a safety control acted, when a placement was reviewed, and when the account-level result became measurable.
The items still requiring monitoring are narrow but consequential: platform-level auction data, independently reproducible evidence of recommendation effects, the lag between safety detection and exposure, and commercial payback after the event rather than only during it. Until those records exist, claims about CPM, ROAS, or algorithm-driven paid-media inflation should remain marked as undocumented.
References
- The World Cup 2026 Field Report — MediaRadar
- FIFA moderates more than 53 million posts and comments during FIFA World Cup 2026 — FIFA, July 2026
- World Cup 2026: Key Lessons from Creator Marketing Campaigns — BeInfluence
- Global sports trends shaping the 2026 World Cup — GWI
- What brand safety tools miss about the World Cup — Fast Company
- World Cup 2026: Racism suffered by England players on X amplified by algorithms - new report — BBC Sport, August 20, 2026
- How 5 brands won World Cup gold through marketing investments — Marketing Dive, August 5, 2026
Primary source: https://www.fifa.com