
Data Center Electricity Costs Are Raising Your Ad Prices in 2026
Trace the documented pass-through chain from AI-driven data center electricity demand through wholesale power spikes and cloud infrastructure cost increases to the CPM and CPC inflation you're seeing on Meta and Google in 2026.
- Platform
- Meta0 Google
- Change category
- policy
- Effective date
- 0-07-24
- Change type
- policy shift
Tracker verdict, July 24, 2026: a measurable share of 2026 ad cost inflation can now be traced through a documented infrastructure chain: AI-heavy data center electricity demand rose, wholesale power prices moved sharply in key markets, hyperscalers published cloud and compute price increases, and advertisers are seeing higher Meta CPCs, CPMs, and explicit audience surcharges. The weak link is the last one. Meta and Google have not disclosed that a specific percentage of CPM or CPC inflation came from electricity, cloud, or AI infrastructure costs. That final pass-through is inferred from timing, published vendor pricing, and platform-facing fees, not proven from an ad-platform cost breakdown.
That distinction matters if the dashboard problem is practical rather than theoretical. If CPMs, CPCs, or blended CPA are up in 2026 after frequency, auction overlap, creative rotation, landing-page speed, learning resets, and budget pacing have already been checked, the answer is not simply that the account missed a hidden optimization lever. The chain connecting data center electricity costs, AI infrastructure demand, and advertising costs has become substantial enough to include in the explanation. It has not become clean enough to replace auction competition, targeting degradation, creative fatigue, or product-market pressure as explanations.
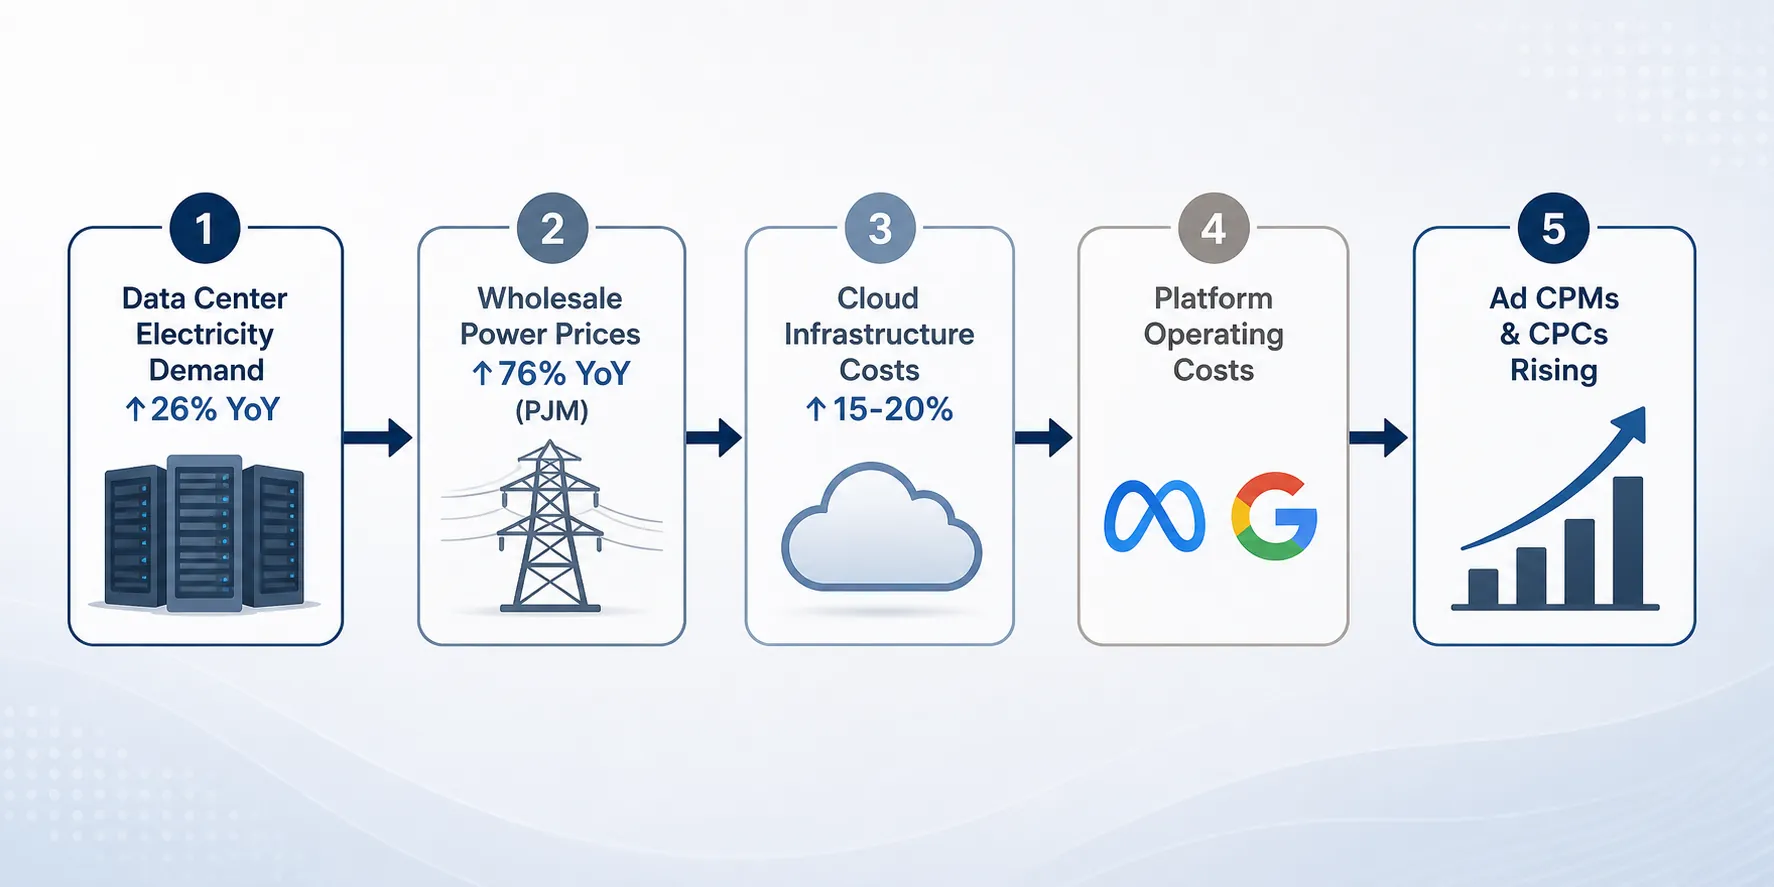
| Pass-through node | Published metric | Source timing | Confidence |
|---|---|---|---|
| Data center electricity demand | Data center electricity consumption grew 26% YoY to 565 TWh in 2026; AI-optimized servers accounted for 31%. [1] | Gartner, June 10, 2026 | High for total data center demand; narrower for ad-serving impact because ad workloads are not separately isolated. |
| Wholesale power pressure | PJM wholesale prices rose 76% YoY, from $77.78/MWh in Q1 2025 to $136.53/MWh in Q1 2026. [2] | Monitoring Analytics Q1 2026 report, cited by Yahoo Finance | High for PJM market movement; not a national average. |
| Broader electricity inflation | Electricity prices rose 6.9% in 2025 versus 2.9% headline inflation, with Goldman Sachs expecting another 6% rise through 2027. [3] | CNBC, Feb. 12, 2026 | Medium-high for macro pressure; the attribution to AI data centers is part of a broader power-market explanation. |
| Local data-center-cluster effects | Bloomberg reported electricity price increases of up to 267% near data center clusters. [4] | Bloomberg, September 2025 | High for localized cases; should not be generalized to every grid region. |
| Public cost-allocation fight | CNBC documented the policy debate over whether ratepayers or tech companies should bear AI electricity costs. [5] | CNBC, March 13, 2026 | High as evidence that the cost burden has moved beyond tech-sector budgeting. |
| Cloud compute pricing | AWS raised EC2 Capacity Blocks for ML by 15% in January 2026 and another 20% starting July 2026, citing supply-demand for AI compute. [6] | Business Insider, June 2026 | High for the listed AWS product; not a full AWS price index. |
| Google Cloud infrastructure pricing | Google Cloud pricing changes effective May 1, 2026 raised CDN Interconnect, Peering, and AI compute infrastructure pricing. [7] | Google Cloud, effective May 1, 2026 | High for the named Google Cloud services; not direct evidence of Google Ads pricing. |
| Estimated infrastructure pass-through | SoftwareSeni estimated cloud providers are passing through 5–10% of infrastructure cost increases to customers, with server-level costs rising 15–25% across Dell and Lenovo in 2025–2026. [8] | SoftwareSeni, 2026 analysis | Medium; useful directional estimate, not an audited industry-wide pass-through rate. |
| Platform ad-cost movement | Meta reported a 14% jump in ad costs against 6% impression growth, according to Coinis citing Meta 2025 financial data. [9] | Coinis, February 2026 | Medium; based on Meta financial data but interpreted by a commercial ad-services source. |
| Advertiser-facing benchmarks | Digital Applied reported Q1 2026 Facebook average CPC of $1.72, up 11% YoY from $1.55; conversion-optimized Meta CPM of $14.68, up 13%; and lead generation CPM of $12.37, up 14%. [10] | Digital Applied, Q1 2026 benchmarks | Medium; useful benchmark sample across 18 industries, but not independently audited. |
| Explicit advertiser surcharge | Meta location fees of 2–5% for European audiences started in July 2026, according to Common Thread Collective. [11] | Common Thread Collective, July 2026 | Medium-high for the fee’s advertiser-facing effect; not proof that all CPM inflation follows the same mechanism. |
The strongest evidence is upstream of the ad account
The cleanest part of the chain starts before Meta Ads Manager or Google Ads enters the conversation. Gartner’s June 2026 figure is the anchor: worldwide data center electricity consumption grew 26% year over year to 565 TWh in 2026, and AI-optimized servers accounted for 31% of that consumption. [1] That does not say ad-serving compute caused the increase. It does say the infrastructure layer that powers AI workloads, cloud platforms, model training, model inference, recommendation systems, measurement, and ad delivery is drawing materially more power.
For a media buyer, the relevant accounting question is not whether an individual impression can be traced back to a watt-hour. It is whether the shared infrastructure stack underneath ad platforms is getting more expensive at a scale large enough to matter. Gartner’s number clears that first bar. It puts electricity demand growth at the top of the system, before any platform-specific auction explanation starts.
The next question is whether demand pressure is visible in real power markets. In PJM, it is. Monitoring Analytics’ Q1 2026 report showed wholesale prices up 76% year over year, from $77.78/MWh in Q1 2025 to $136.53/MWh in Q1 2026. [2] PJM is not the whole United States, and it is not a clean proxy for every data center region. But the size and timing of that move make it hard to treat electricity as a stable background cost.
The pressure is also not confined to one grid operator’s quarterly data. Goldman Sachs, cited by CNBC, said electricity prices rose 6.9% in 2025, more than double headline inflation of 2.9%, and expected an additional 6% increase through 2027. [3] Bloomberg’s September 2025 reporting went narrower and more local, finding electricity price increases of up to 267% near data center clusters. [4] The two facts do different jobs: Goldman shows broad inflation pressure; Bloomberg shows how data center concentration can create much sharper local effects.
That is why the CNBC ratepayer debate belongs in an ad-cost tracker even though it is not an advertising story on the surface. By March 2026, the question of who pays for AI’s electricity costs had become a public policy fight over ratepayer protection and tech-company responsibility. [5] Once that argument is happening in state utility and power-market terms, electricity is no longer just a line buried inside a hyperscaler’s operating budget. It is a contested cost pool with multiple possible payers.
Cloud price changes turn power pressure into customer invoices
Electricity inflation alone would still be too remote from an ad account if cloud providers were absorbing the cost indefinitely. The 2026 evidence does not support that assumption. AWS raised EC2 Capacity Blocks for ML by 15% in January 2026 and another 20% starting July 2026, with the increase tied to supply-demand conditions for AI compute. [6] That is a narrow product category, not a universal AWS rate card. It is still a direct example of AI compute scarcity showing up as a higher posted price.
Google Cloud made its own infrastructure pricing changes effective May 1, 2026, affecting CDN Interconnect, Peering, and AI compute infrastructure pricing. [7] Again, that is not the same thing as Google Ads raising CPCs. It is evidence that one of the major infrastructure providers has moved prices on services that sit closer to data transfer, connectivity, and AI compute than to a consumer-facing software subscription.
The mechanics are not mysterious. Higher power costs raise the cost of running capacity. AI demand raises the price of scarce accelerated compute. Server and memory costs pressure the replacement and expansion cycle. Network and peering price changes affect the movement of traffic. A cloud provider can absorb some of that, renegotiate some of it, or pass some of it through. The 2026 price changes show that at least some pass-through is already happening in named products.
SoftwareSeni’s estimate puts the pass-through range at 5–10% of infrastructure cost increases to cloud customers, while server-level costs rose 15–25% across Dell and Lenovo in 2025–2026. [8] That estimate should be treated carefully. It is not an audited financial statement from every major cloud provider. But it fits the observable pattern: hardware and energy pressure upstream, then selective cloud price increases downstream.
This part of the chain deserves the most weight. It contains named dates, named services, published percentage changes, and real wholesale power movement. A finance team may still ask how much of a specific account’s CPM increase came from those inputs. That exact answer is not available. But the existence of a higher infrastructure-cost layer is no longer speculative.
The ad-market evidence is real, but the attribution is not fully disclosed
The final link is where the evidence gets more useful for account reviews and less satisfying for attribution. Coinis, citing Meta 2025 financial data, reported that Meta saw a 14% jump in ad costs against only 6% impression growth. [9] That spread is directionally consistent with advertisers feeling higher prices without a matching expansion in inventory. It does not disclose how much of that movement came from infrastructure, bidder density, targeting quality, Reels mix, conversion-modeling changes, or advertiser behavior.
Digital Applied’s Q1 2026 benchmarks make the advertiser-facing movement more concrete. Across 18 industries, it reported Facebook all-industry average CPC at $1.72, up 11% year over year from $1.55; Meta conversion-optimized campaign CPM at $14.68, up 13%; and lead generation CPM at $12.37, up 14%. [10] Those are the kinds of numbers that show up in monthly review decks. The caveat is source quality: agency and service-provider benchmarks are useful, especially when the direction matches what operators are seeing across accounts, but they are not audited platform disclosures.
Meta’s July 2026 European audience surcharge is the more direct pass-through example. Common Thread Collective reported Meta location fees of 2–5% for European audiences starting in July 2026. [11] A surcharge is cleaner than a CPM trend because the advertiser can see an external cost become an advertiser-facing fee. It still should not be stretched into proof that every point of CPM inflation is electricity pass-through. It proves the platform can add explicit cost layers when external conditions warrant it; it does not prove the composition of the auction price.
For Google, the documented evidence in this tracker is more upstream than advertiser-facing. Google Cloud’s May 2026 infrastructure price changes are real. [7] There is no matching Google Ads disclosure showing that search or YouTube ad prices rose by a stated percentage because of electricity or cloud infrastructure costs. That means Google belongs in the infrastructure-cost discussion, but the final ad-price attribution is weaker than the cloud-price evidence.
How this should change the 2026 account review
The practical adjustment is not to stop optimizing. If frequency is high, creative is stale, auction overlap is ugly, or a campaign just came out of a budget reset, those are still account-level problems. The adjustment is to stop treating every unexplained CPM or CPC increase as proof that the media buyer missed something inside the account.
A cleaner review narrative separates three layers. First, account-controllable causes: creative, landing page, budget pacing, audience structure, bid strategy, and conversion signal quality. Second, market causes: more bidders, seasonal demand, category competition, and privacy-driven measurement loss. Third, structural platform-cost causes: power, compute, cloud infrastructure, regulatory fees, and platform operating costs. The 2026 evidence is strong enough to include the third layer; it is not strong enough to assign a precise dollar amount from that layer to a specific campaign’s CPA.
That distinction can keep a review from drifting into folklore. Saying competition is up may be true, but it is incomplete when electricity consumption, wholesale power prices, AI compute rates, and cloud infrastructure prices have all moved in the same window. Saying AI infrastructure explains everything is just the opposite mistake. The documented chain supports structural pressure, not total attribution.
What to watch next
The next updates that would strengthen or weaken this tracker are specific. PJM’s June 2026 capacity auction results will show whether power-market pressure is continuing into forward capacity pricing. Hyperscaler Q3 2026 capex reports will show whether AI infrastructure spending is still accelerating or beginning to normalize. Any new Meta or Google fee announcement would matter most if it makes the final link explicit: an external infrastructure, regulatory, or operating cost translated into an advertiser-facing charge.
Until then, the defensible statement is narrow but important: infrastructure costs are now a real structural layer in paid-media economics. They sit beside auction competition and account execution. They do not erase either one.
References
- Gartner Says Data Center Electricity Demand to Grow 26 Percent in 2026, Gartner, June 10, 2026
- AI data centers trigger massive, Yahoo Finance, Q1 2026
- Electricity price data center AI inflation Goldman, CNBC, February 12, 2026
- AI data centers electricity prices, Bloomberg, September 2025
- AI data centers electricity prices backlash ratepayer protection, CNBC, March 13, 2026
- Amazon Raises AI Cloud Prices as Memory Chip Costs Soar, Business Insider, June 2026
- Cloud CDN, Cloud Interconnect, and Cloud Peering pricing changes, Google Cloud, May 1, 2026
- How Much Will Your Cloud Bill Increase in 2026? Analysing the Infrastructure Cost Passthrough, SoftwareSeni
- Why Meta Ads Are More Expensive in 2026, Coinis, February 2026
- Facebook Ads Benchmarks 2026: CPC, CPM & CTR by Industry, Digital Applied, Q1 2026
- Meta Ads Changes 2026, Common Thread Collective, July 2026
Primary source: https://www.gartner.com/en/newsroom/press-releases/2026-06-10-data-center-electricity-demand