
The AI selloff is pricing capex, not ad tech budgets
A dated log of the 2026 AI-stock selloffs and what each actually changed for ad budgets. Platform ad revenue kept compounding through late July 2026 while the selling stayed focused on capex — the record separates that valuation noise from the ad-tech declines driven by real fundamentals.
- Platform
- Google, Meta
- Change category
- bidding
- Effective date
- 2026-07-22
- Change type
- capex valuation
- Impact level
- Low
The dated answer
Through late July 2026, the impact of the AI-stock selloff on ad-tech budgets is still mostly a valuation story, not an operating ad-demand story. The cleanest read is that investors have been repricing the cost, timing, and return profile of AI infrastructure spending. That is different from saying advertisers have already pulled budgets from Google, YouTube, Meta, Performance Max, Advantage+, AI Max, or the open web.
There are real ad-tech declines in the record. Trade Desk, AppLovin, PubMatic, Criteo, and the SSP tier cannot be waved away as market noise. But those moves belong in a different file: slowing growth, margin compression, partner disputes, measurement signals, guidance cuts, and exposure to programmatic fundamentals. They are not proof that the chip-led and hyperscaler-led AI selloffs had already turned into a broad platform ad-budget pullback.

Tracker log through late July 2026
| Date | What moved | Ad-demand evidence available at that point | Bucket |
|---|---|---|---|
| Jan. 7–29; published Mar. 31 | The CMO Survey found marketing budgets down to 9.0% of company revenue, 1.7% spend growth, and pessimism at its highest level since mid-2020, from 308 marketing leaders. [1] | This was the strongest budget-side warning in the record. It measured marketer sentiment and budget pressure, not a platform ad-revenue miss. | Budget pressure signal |
| Jan. 28 | IAB forecast 2026 U.S. ad spend growth of 9.5%, with social at +14.6% and CTV at +13.8%. [2] | The industry forecast still pointed to growth. It did not rule out advertiser caution, but it pushed against the idea that budgets had already rolled over. | Budget-side counterweight |
| Feb. 3–4 | A software and services selloff followed the Anthropic-triggered AI disruption debate: the S&P 500 software and services index fell 13% over six sessions, about $830 billion had been wiped out since Jan. 28, Nvidia fell 3.4%, Meta 3.2%, and Alphabet 2%. [3] | No same-date evidence in this event showed advertisers cutting spend or platform ad auctions weakening. The move was about AI disruption risk and valuation. | AI valuation / disruption |
| May 13 | SSP pressure showed up in Q1 earnings coverage: PubMatic reported Q1 revenue down 2% year over year and its stock fell 7%. [4] | This was real ad-tech operating weakness, but it sat in the SSP layer rather than in Google or Meta ad demand. | Ad-tech fundamentals |
| Jun. 3 | A broad AI-stock selloff took the S&P 500 down 1.6%, the Dow down 953 points, and the Nasdaq down 2%; Nvidia fell 3.7%, Broadcom 5.1%, and Super Micro 28% after a $7 billion equity raise. [5] | The trigger was again valuation and AI-stock risk appetite. The event did not come with a reported ad-demand shortfall. | AI valuation / chip-led selloff |
| Jun. 4 | Ad-tech stock damage was already visible: Trade Desk was down 44% year to date and AppLovin was down 17% in coverage asking whether ad-tech stocks were “dead money” in 2026. [6] | This was not the same fact pattern as a semiconductor selloff. The concern was whether individual ad-tech growth and profitability were holding up. | Ad-tech fundamentals |
| Jun. 18 | Hyperscaler AI capex was estimated to be on pace for about $775 billion in 2026, up 78% year over year. [7] | This is the bill investors were repricing. It says little by itself about whether a retail, travel, fintech, or DTC advertiser changed next week’s media plan. | Capex valuation |
| Jul. 10 | Trade Desk’s first-half decline was reported at 52.4%. Its Q1 growth slowed to 12% from 25% a year earlier, Q2 was guided to 8%, EBITDA margin was 30% versus 47%, and the period included a Publicis fee-audit dispute and a CFO transition. [8] | That is operating evidence, but it is Trade Desk-specific evidence. It does not prove that Google Search, YouTube, or Meta demand had broken. | Ad-tech fundamentals |
| Jul. 13 | AppLovin fell 13% after a BofA note cited softer June e-commerce growth, including roughly 750 new pixels versus roughly 950 in May across about 8,280 merchants. The pixel figures should be treated as third-party, snippet-level data rather than platform-reported financials. [9] | This was a genuine forward-looking concern for AppLovin’s e-commerce ramp. It was not evidence of a broad platform ad-budget cut. | Ad-tech fundamentals / measurement signal |
| Jul. 17 | A global selloff hit the AI chip trade: TSMC fell 7.29%, Netflix 9.24%, KOSPI 6.37%, and Nikkei 4.03%. Apollo’s Torsten Sløk framed the recession risk around AI capex cuts. [10] | The risk channel here was second-order: capex cuts could pressure employment and demand, which could later hit ad budgets. The event itself was not a reported ad-spend contraction. | Capex valuation / second-order macro risk |
| Jul. 22 | Alphabet reported Search revenue up 17% to $63.3 billion, YouTube up 13% to $11.06 billion, cloud up 82% to $24.8 billion, capex of $44.9 billion, and a 2026 capex guide raised to $195 billion–$205 billion. The stock sank after hours despite the beat. [11] | This is the cleanest mismatch in the record: ad revenue was compounding, while investors focused on the AI infrastructure bill. | Capex valuation, not ad-demand miss |
| Jul. 29 | Meta reported Q2 ad revenue of $59.4 billion, up 27%, with impressions up 14% and price per ad up 12%. Free cash flow fell 91% to $784 million, the capex floor moved higher in a reported $130 billion–$145 billion range, the Q3 midpoint was about 1% below consensus, and shares fell roughly 8%–10% after hours. [12] | Again, the operating ad signals were strong. The selloff attached to capex, free-cash-flow pressure, and forward spending anxiety. | Capex valuation with a guide caveat |
Alphabet and Meta are the capex test cases
Alphabet’s July 22 print is the awkward evidence for the simple “AI ad bubble popped” line. Search was not weak in the quarter. YouTube was not weak in the quarter. The company reported Search revenue up 17% to $63.3 billion and YouTube revenue up 13% to $11.06 billion. Those are not auction-clearing-price data, and they are not a guarantee for Q3, but they are platform ad-revenue data at the moment investors were selling the stock after hours. [11]
What changed the tone was the spending line. Alphabet’s capex was $44.9 billion, up 100% year over year, and management lifted the 2026 capex guide to $195 billion–$205 billion. The equity reaction fit the market’s larger question: how much cash has to go into data centers, chips, and AI infrastructure before investors see an acceptable return? That is a serious question for valuation. It is not the same question as whether advertisers stopped buying Search and YouTube impressions in Q2. [11]
Meta made the same distinction harder to ignore a week later. Its ad machine was not just positive; it was accelerating on both volume and price. Q2 ad revenue was $59.4 billion, up 27% year over year, with impressions up 14% and average price per ad up 12%. If a media buyer is looking for evidence of immediate demand failure, that is the wrong print to use. [12]
The stock reaction still made sense as an investor reaction. Free cash flow fell 91% year over year to $784 million, the capex floor moved higher in a reported $130 billion–$145 billion range, and the Q3 revenue midpoint sat about 1% below consensus. That combination can hit a stock without proving that Advantage+ budgets, Reels demand, or broader social spend have rolled over. [12]
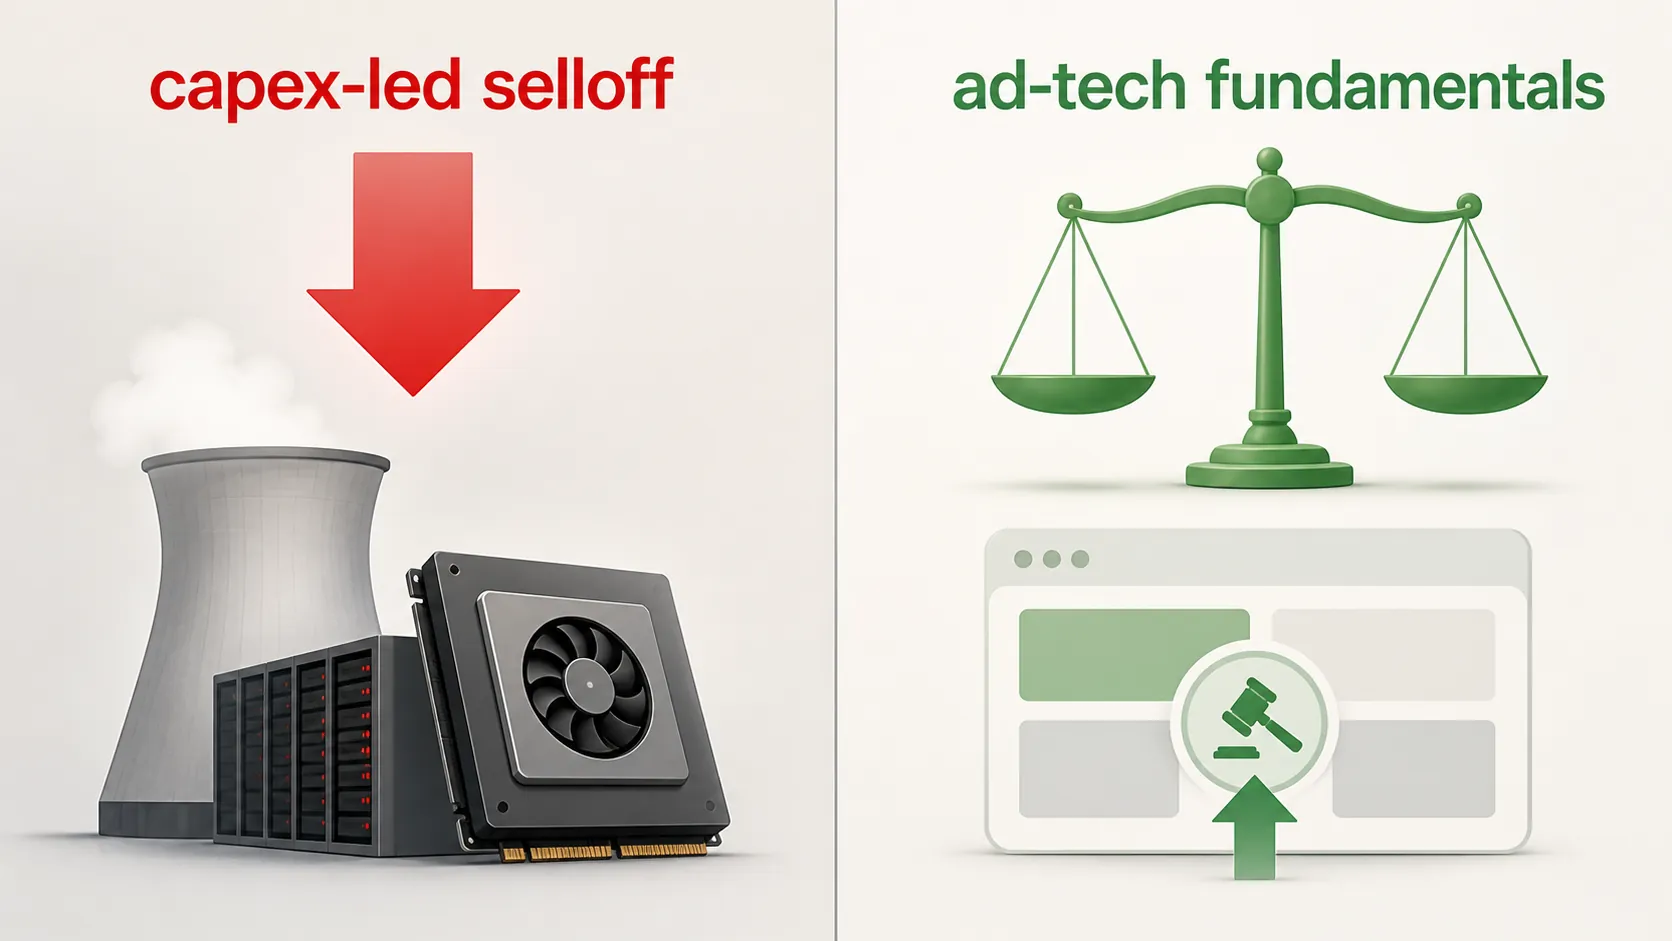
This is why the chronology matters. If the selloff follows a capex guide while ad revenue, impressions, and price are all still growing, the operating diagnosis should not be “advertisers fled.” The diagnosis is narrower: investors became less willing to fund AI infrastructure at the same multiple.
The ad-tech exception bucket is real
The clean capex story breaks if every ad-tech decline is treated as irrelevant. Trade Desk’s first half was not just a sympathy trade. A 52.4% first-half stock decline, Q1 growth slowing to 12% from 25% a year earlier, Q2 guidance of 8%, EBITDA margin compression to 30% from 47%, a Publicis fee-audit dispute, and a CFO transition are all fundamentals. [8]
Those facts matter for agencies, holdcos, and programmatic buyers because Trade Desk is closer to budget routing and open-web demand than Nvidia is. If Trade Desk’s Q2 print in early August confirms slower spend or weaker take-rate dynamics, that would be a more relevant ad-budget signal than a chip-stock drawdown. But the distinction cuts both ways: Trade Desk-specific deterioration cannot be automatically backfilled into Google and Meta’s Q2 ad revenue when those platforms had just reported double-digit growth.
AppLovin belongs in the same exception bucket for a different reason. The July 13 BofA note focused on softer June e-commerce growth, with roughly 750 new pixels in June versus roughly 950 in May across about 8,280 merchants, and the stock fell 13%. Because those pixel figures come from third-party data cited in coverage rather than AppLovin’s own financial filing, they should not be over-weighted. They are still a live signal for AppLovin’s e-commerce expansion and partner onboarding momentum. [9]
The SSP tier also has its own problems. PubMatic’s Q1 revenue decline of 2% year over year and 7% stock drop were tied to supply-side operating pressure, not to Alphabet’s capex guide. [4] Criteo’s guidance cut and stock decline of more than 20% sit in the same ad-tech fundamentals file. [6]
That means buyers should resist two sloppy shortcuts. The first is using Nvidia, TSMC, or hyperscaler selloffs as immediate evidence to pause paid media. The second is using Google and Meta’s strong Q2 prints to dismiss all ad-tech weakness. The open web, retail-media-adjacent performance platforms, and social/search walled gardens are not all giving the same signal at the same time.
Budget pressure exists, but the dates do not show a platform miss
The budget-side evidence is mixed, which is exactly why it should stay in the tracker rather than be converted into a clean market narrative. The CMO Survey is the pressure signal: budgets at 9.0% of company revenue, spend growth of 1.7%, and pessimism at the highest level since mid-2020 are not nothing. They say marketers were cautious before the biggest July capex reactions arrived. [1]
But the IAB’s January outlook still forecast 9.5% U.S. ad-spend growth for 2026, including 14.6% growth in social and 13.8% growth in CTV. Forecasts can miss, and they are not the same as booked spend. Still, they are not consistent with an already visible collapse in advertiser demand. [2]
The better risk channel is second-order. If AI capex disappointment leads to spending cuts, hiring freezes, layoffs, weaker consumer demand, or tighter CFO controls, ad budgets can get hit later. Apollo’s July 17 framing around capex-cut recession risk belongs there. It is a macro transmission risk, not a same-week ad-auction datapoint. [10]
What buyers should watch next
For a performance team with a pacing sheet open, the practical read is simple enough: do not change budgets because semiconductor or hyperscaler valuation anxiety sold off. Change budgets when the channel’s own economics change — conversion volume, marginal CPA, auction price, ROAS, incrementality, or platform guidance.
- Trade Desk’s Q2 print in early August: the open-web signal is more relevant to ad-tech budgets than another chip-led selloff.
- Meta’s Q3 guide: Q2 showed strong ad revenue, impressions, and price, but the Q3 midpoint was already slightly below consensus.
- Google’s Q3 Search comparison: the July print was strong, but the next comp will show whether the 17% Search growth rate is durable.
- AppLovin’s July pixel recovery: June softness was a real warning for its e-commerce story, but it needs confirmation from fuller data.
- Budget surveys and CFO commentary: the first-order platform prints have held up; the remaining risk is whether macro caution catches up to spend plans.
The record through late July 2026 does not show a major platform ad-demand shortfall. It shows strong platform ad revenue beside investor discomfort with the size of the AI infrastructure bill, plus a separate set of ad-tech companies dealing with real fundamentals pressure.
References
- CMOs Face Headwinds Even as Marketing Value and AI Impact Grow — The CMO Survey, Duke Fuqua, Mar. 31, 2026
- IAB 2026 Outlook Study Forecasts 9.5% Growth in U.S. Ad Spend, IAB, Jan. 28, 2026
- Selloff wipes out nearly $1 trillion from software and services stocks as investors debate AI's existential threat, Reuters, Feb. 4, 2026
- PubMatic and Magnite Report Q1 Earnings, AdTechRadar, May 13, 2026
- Another sell-off for AI stocks knocks Wall Street back to where it was 5 weeks ago, AP News, Jun. 3, 2026
- Trade Desk Is Down 44% This Year and AppLovin Is Down 17%. Are Ad-Tech Stocks Dead Money in 2026?, 24/7 Wall St., Jun. 4, 2026
- Is Big Tech's AI CapEx Boom Sustainable?, American Century Investments, Jun. 18, 2026
- Why Trade Desk Stock Lost 52% in the First Half of 2026, Motley Fool, Jul. 10, 2026
- AppLovin's Ecommerce Growth Soft In June, Says BofA Citing Third-Party Data, Yahoo Finance, Jul. 13, 2026
- Tech stocks lead steep global selloff as investors lose faith in AI chip trade, Fortune, Jul. 17, 2026
- Google (GOOG) Q2 2026 earnings report: Live updates, CNBC, Jul. 22, 2026
- Meta Q2 2026: Ad Machine Strong, Capex Spooks the Street, Digital Applied, Jul. 30, 2026
Primary source: https://abc.xyz/investor/