

How to Evaluate AI Marketing Analytics Tools: What Actually Differentiates Them
Learn the four practical criteria that truly differentiate AI marketing analytics tools — integration depth, AI output type, data normalization, and pricing transparency — so you can cut through vendor hype and make an informed tool selection.
Every platform in an AI in marketing analytics shortlist now promises some version of “insight.” That is exactly why the label is no longer useful. The real evaluation question is simpler: when the dashboard looks polished, can the tool still keep Facebook, Google Ads, HubSpot, Salesforce, GA4, and spreadsheet imports aligned well enough to trust the numbers it is summarizing?
That gap between demo-visible AI and implementation-visible reliability is the whole story. What usually separates one tool from another is not whether it can say “AI-powered,” but whether it connects cleanly, normalizes data consistently, exposes what its AI is doing, and prices the feature set in a way procurement can understand before usage spikes turn into a surprise.
The four criteria that actually matter
A practical comparison starts with four filters. First, integration depth and connector stability: the AI output is only as reliable as the source data feeding it. Second, the level of AI output: some tools only summarize what already happened, while others forecast and fewer still recommend actions. Third, normalization: the platform has to reconcile naming, attribution, time windows, and metric definitions across systems. Fourth, pricing transparency: if the plan looks simple only until AI usage or extra credits kick in, the headline number is not the real number.
| Tool | Pricing / model to verify | What to inspect in a demo |
|---|---|---|
| Whatagraph | $229–$579/month, unlimited users, source-credit model [1] | Check connector depth, credit consumption, and whether AI summaries stay usable when multiple data sources are blended. |
| HockeyStack | Verify current plan structure directly [2] | Ask whether its AI output is descriptive, predictive, or prescriptive, and which data sources it can reconcile without manual cleanup. |
| AgencyAnalytics | Verify current plan structure directly [1] | Confirm how it handles recurring client reporting, custom metrics, and source consistency across accounts. |
| Klipfolio | $90–$1,025/month [1] | Test how pricing changes with scale, dashboard count, or advanced AI features before assuming the lower tier will hold. |
| Databox | Verify current plan structure directly [1] | Check whether the AI layer is only summarizing dashboards or can surface predictive or prescriptive guidance. |
| TapClicks | Can exceed $1,500/month for AI capabilities [1] | Ask exactly which AI functions are included, how usage is metered, and what pushes the account into the higher tier. |
That table is not meant to crown a winner. It is a screening sheet. The same tool can look inexpensive, flexible, or “AI-first” until you ask how it behaves when a client account has inconsistent campaign naming, when CRM revenue does not line up with ad platform conversion data, or when the team wants to automate reporting across several workspaces instead of one polished demo account.
Integration depth is the first test, not the last
The easiest mistake is to treat integration as a setup item and AI as the value item. In practice, they are the same test. If a platform cannot keep its connectors stable or has to rely on brittle workarounds for common sources, the AI layer inherits that weakness. A clean-looking summary built on stale, duplicated, or mismatched inputs will still be wrong, just more convincingly formatted.
In a demo, the useful questions are concrete: which connectors are native, which depend on third parties, how often they refresh, how they handle API changes, and what happens when a source breaks. The answer matters more than any polished insight card. A vendor that can explain connector maintenance, field mapping, and error handling clearly is already giving you more signal than one that only shows the output layer.
This is also where multi-client and multi-channel teams feel the pain fastest. One broken connector can distort a dashboard, but a dozen almost-right connectors can make leadership distrust the entire reporting stack. The tool does not need to be perfect; it does need to be legible when something goes wrong.
AI output type tells you what the tool can really do
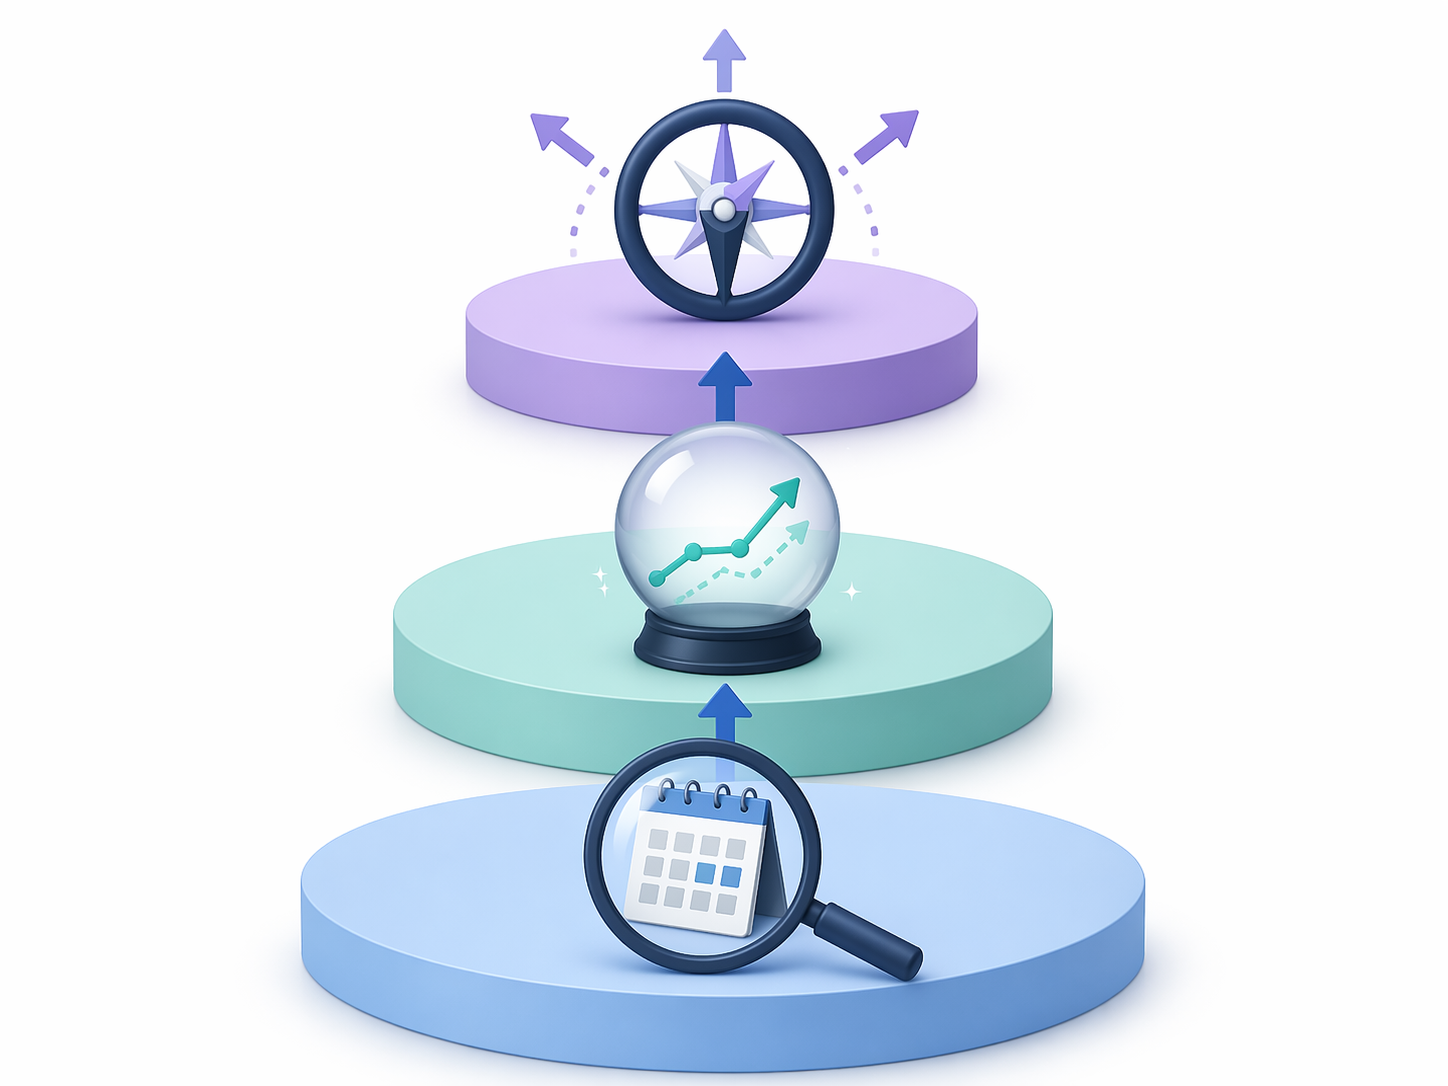
Not all AI in marketing analytics is doing the same job. Some tools are descriptive: they summarize what happened, highlight anomalies, or draft a narrative around last month’s performance. Others are predictive: they estimate what may happen next based on patterns in the data. A smaller group is prescriptive: they recommend a budget shift, a targeting change, or another action the team could take. Vendor language often blurs those layers, so the buyer has to separate them deliberately [2][3].
That distinction matters because many teams only need the first layer and assume they are buying the third. A platform that writes cleaner summaries may be enough for weekly reporting, but it is not the same product as one that forecasts outcomes or suggests reallocations. If a vendor says “AI insights” without naming the level of output, ask what decision the system can actually influence and what it only describes after the fact.
The most useful demo request is not “show me the AI.” It is “show me where the AI begins and ends.” If the answer is a neat narrative over a static dashboard, that is descriptive automation. If it can explain why a channel is likely to underperform next week, that is a different claim. If it recommends the budget move and shows the assumptions behind it, that is a stronger one still. Those are not interchangeable levels of maturity.
Normalization is the part that makes connected data usable
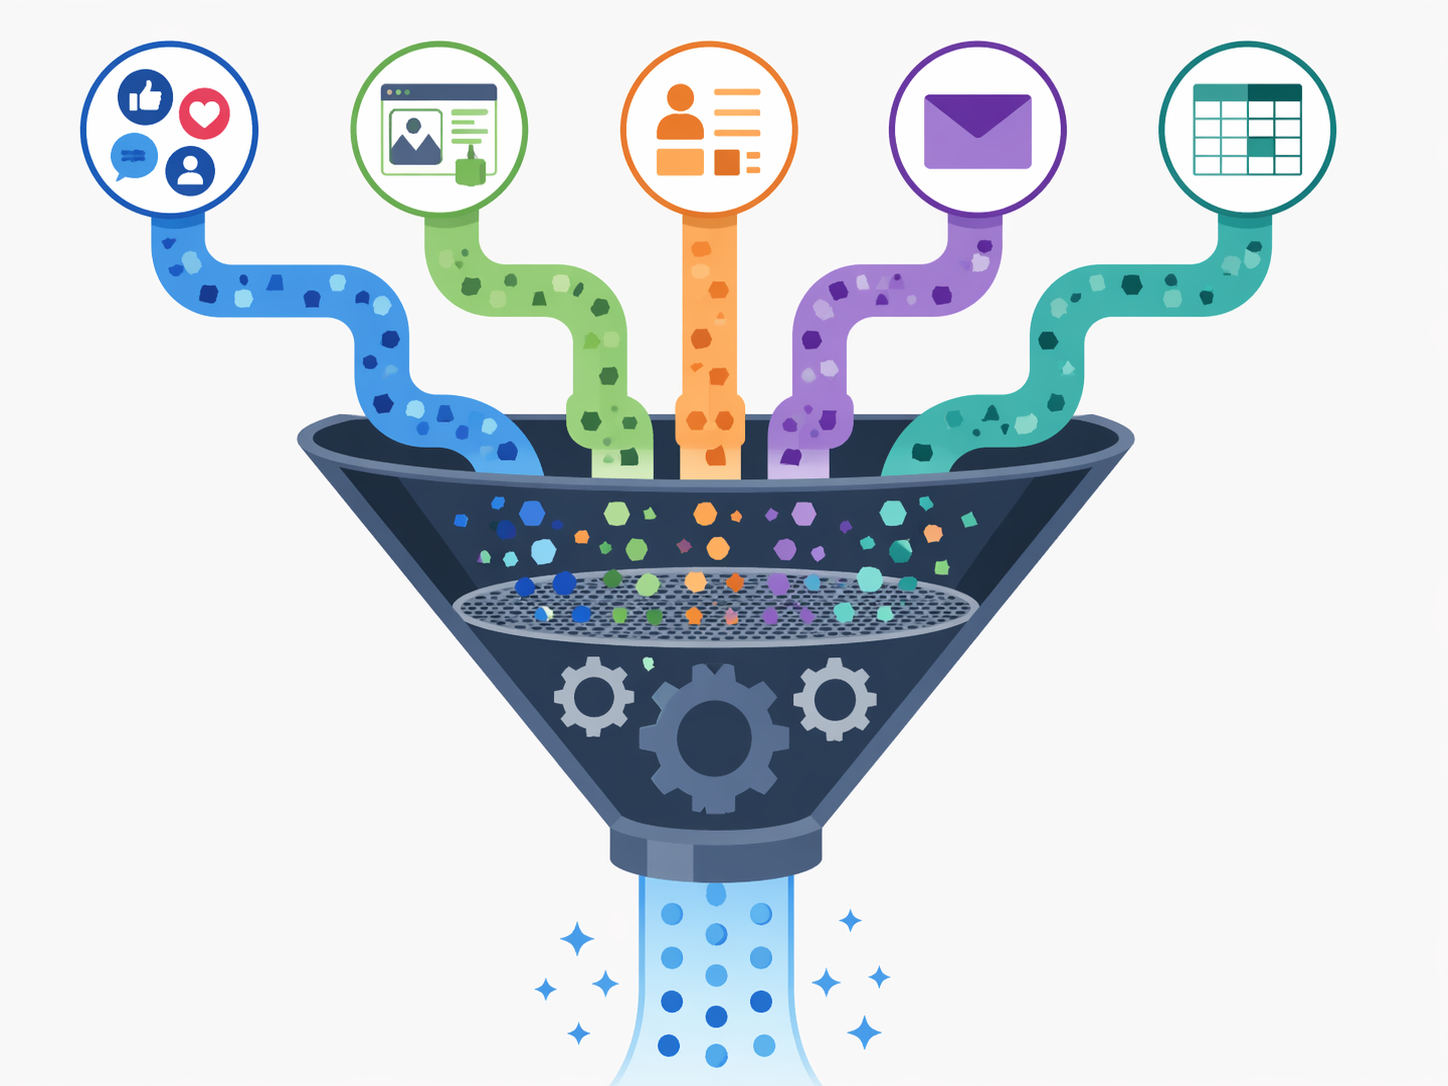
Normalization sounds technical because it is technical, but the buyer problem is ordinary. One system calls the same campaign differently. Another uses a different time zone or attribution window. A CRM field does not match the ad platform’s conversion event. The platform may still connect everything, yet the joined dataset is not comparable until the tool reconciles those differences.
This is why a tool can feel integrated and still produce reporting that nobody trusts. Data normalization is not an enterprise-only concern or a back-office luxury. It matters any time a team compares ad, email, CRM, and revenue data in the same place. LatentView and Pixis both treat normalized inputs as a prerequisite for meaningful AI use cases, and that framing is the right one: AI does not rescue messy data; it amplifies whatever is already there [4][5].
The demo question here is straightforward: what does the platform do when two sources disagree? Some tools simply surface the conflict. Better ones give you mapping rules, transformation logic, or controlled definitions that persist over time. If the answer relies on manual cleanup in spreadsheets, the shiny AI layer is sitting on a reporting workflow the tool never really solved.
Pricing transparency is a feature, not just a finance issue
Pricing deserves the same scrutiny as connectors because hidden cost is part of operational risk. Whatagraph’s roundup shows how wide the spread can be: Whatagraph is listed at $229–$579 per month with unlimited users and a source-credit model; Klipfolio at $90–$1,025 per month; and TapClicks at more than $1,500 per month for AI capabilities [1]. Those numbers are useful as anchors, but they come from a vendor-created comparison and should be verified directly because pricing changes quickly [1].
The practical issue is not whether a tool is expensive. It is whether the cost structure is legible. AI features may sit behind a higher tier, usage credits may reset monthly, or add-ons may unlock the part of the product you actually came to evaluate. If procurement has to infer the real price from a sales call, the platform is already making the buyer carry more risk than it should.
A good pricing review asks three things: what is included now, what counts as usage, and what changes the plan tier. If those answers are vague, the sticker price is not the decision price. That is especially true for AI functions, where the vendor may market the feature broadly but meter access narrowly.
How to pressure-test a shortlist in one demo cycle
A useful demo does not need a script full of theory. It needs a small set of tasks that reveal whether the tool can survive real reporting conditions. Use the same scenario across vendors: connect at least two paid media sources, one CRM, and one spreadsheet import; ask for a normalized view of a shared metric; then ask the AI layer to explain, predict, or recommend something specific. The differences will show up quickly.
- Which connectors are native, and which depend on external middleware or manual maintenance?
- When sources disagree, does the tool normalize them automatically or leave the reconciliation work to the user?
- Is the AI output descriptive, predictive, or prescriptive, and can the vendor show the difference without hand-waving?
- What exactly triggers a higher tier, a usage overage, or an AI add-on cost?
There is no independent benchmark here that settles which platform has the best AI output, and that is worth saying plainly. Vendor blogs can help define categories, and review sentiment can reveal where users feel friction, but neither is a controlled audit. The buyer still has to test the environment that matters: the one with their data, their connectors, and their reporting definitions.
The best AI marketing analytics tool is not the one with the most polished insight card. It is the one whose integrations stay intact, whose normalization layer makes mixed-source data usable, whose AI output matches the decision you actually need, and whose pricing does not turn into a procurement argument after the pilot.
References
- “6 Best AI Marketing Analytics Tools in 2026” — Whatagraph
- “AI Marketing Analytics” — HockeyStack
- “AI Marketing Analytics” — Improvado
- “AI in Marketing Analytics” — LatentView
- “AI Marketing Analytics” — Pixis

Comments
Join the discussion with an anonymous comment.