
Which AI Marketing Use Cases Actually Deliver ROI in 2026
This article breaks down AI marketing ROI by specific use case — content drafting, personalization, audience research, video, and paid social creative — and explains why the gap between the best and worst performers is nearly 3x. It provides a measurement framework and payback timelines to help managers prioritize tool investments.
The budget question around AI-powered marketing is no longer whether the team owns enough tools. It is which workflows can survive a finance review after the first invoice cycle. The useful benchmark is not a blended “AI ROI” number; it is the spread by use case.
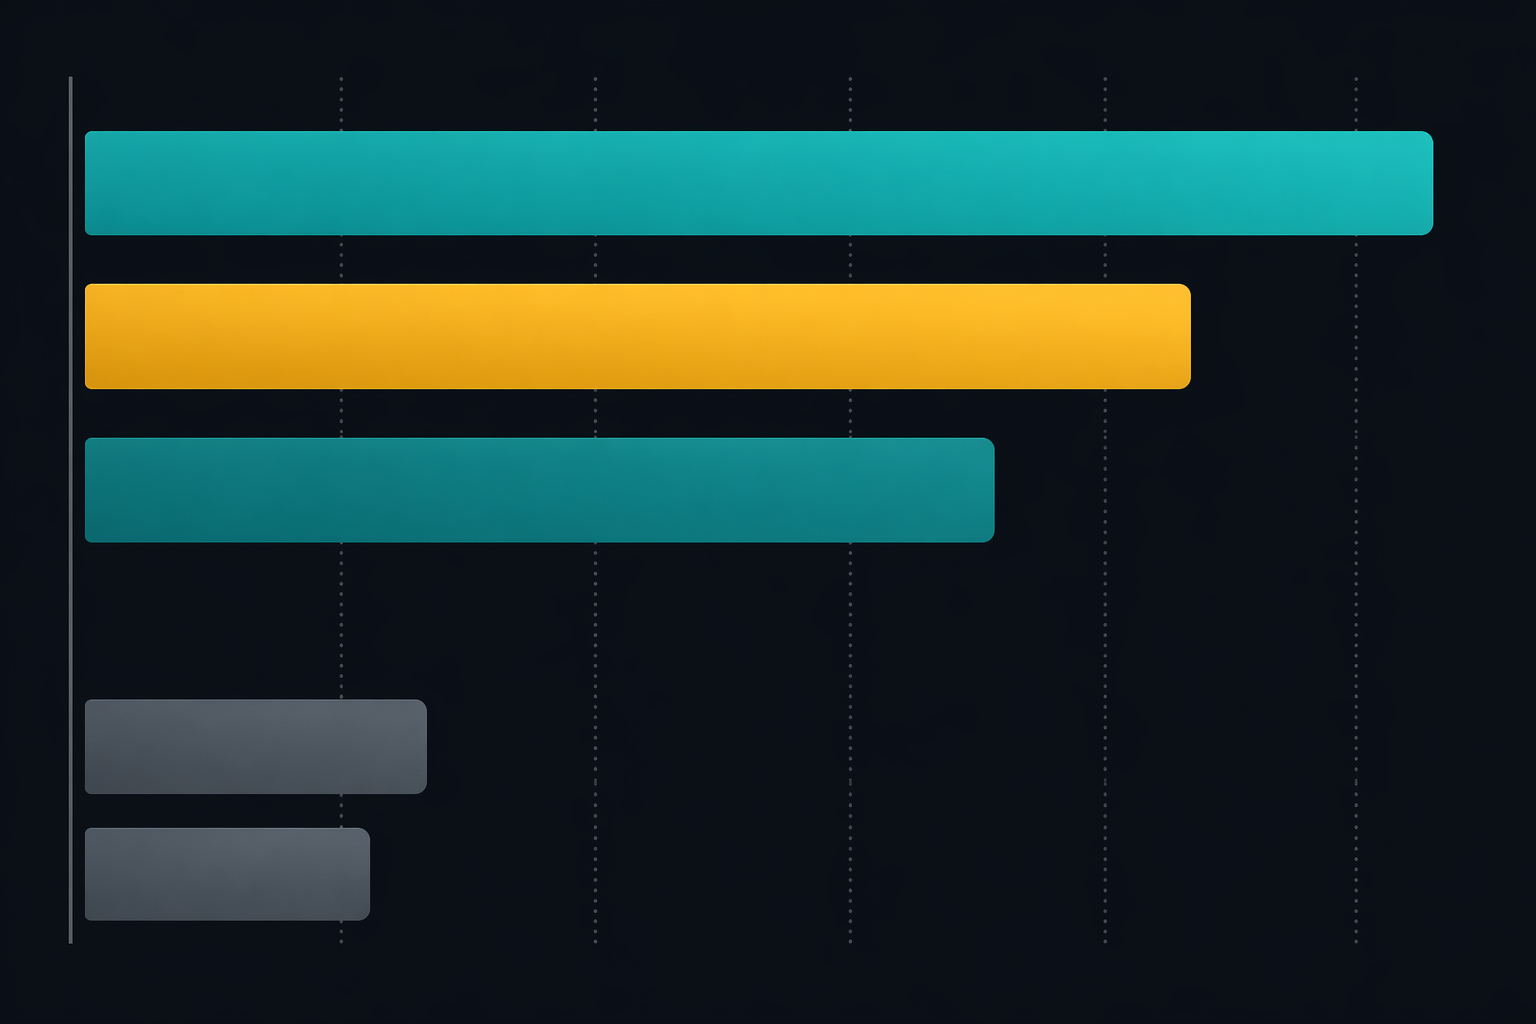
On that basis, the 2026 picture is uneven. Content drafting reports the strongest average return at 3.2x, with an interquartile range of 2.4x to 4.1x. Personalization follows at 2.7x, audience research at 2.4x, while AI video sits between 1.1x and 1.6x and AI-generated paid social creative trails at 1.2x.[1]
| Use case | Reported ROI | What the number usually reflects | Budget read |
|---|---|---|---|
| Content drafting | 3.2x average; IQR 2.4x-4.1x | More first drafts, briefs, variants, and repurposed assets per content staff hour | Fund first, especially where review workflows are already clear |
| Personalization | 2.7x | More relevant messaging across segments, lifecycle stages, or product interests | Strong fit when there is enough customer data and traffic volume |
| Audience research | 2.4x | Faster synthesis of customer signals, segmentation inputs, and message testing hypotheses | Fund when the output changes targeting, positioning, or offer decisions |
| AI video creation | 1.1x-1.6x | Some concepting or asset generation speed, but continued production, review, editing, and brand-control costs | Test narrowly before treating it as a production replacement |
| AI-generated paid social creative | 1.2x | More creative variants, often with weak durability when ads look generic or obviously synthetic | Keep experimental unless incrementality proves otherwise |
The caveat matters. The 3.2x content drafting figure is enterprise-weighted, and blended AI marketing ROI differs meaningfully by company size: enterprise teams report 3.4x blended ROI, while SMB teams report 2.3x. The advantage is tied less to “better AI” in the abstract than to the scale at which larger teams can apply personalization and audience research across bigger customer bases.[1]
That does not make the table useless for smaller teams. It makes the ranking more useful than the headline number. A smaller team may not reach the enterprise-weighted average for content drafting, but the same workflow economics still apply: if the tool removes repetitive drafting time without adding an equal review burden, the payback path is visible.
Why the High-ROI Use Cases Pay Back Faster
Content drafting performs well because it enters the workflow at a point where marketing teams already know how to judge the output. A strategist can reject a weak angle. An editor can reshape a draft. A product marketer can correct the positioning. The AI does not need to own the final asset to create value; it only needs to reduce the time spent getting from a blank page to something reviewable.
That distinction is easy to miss in tool demos. The return is not that an AI writing tool “replaces content.” The return is that it compresses brief creation, first-draft production, metadata variants, content refreshes, social cutdowns, and landing-page alternatives. Those are measurable units of work. They also tend to be bottlenecked by people who are expensive to leave staring at an empty document.
Personalization earns its place for a different reason: it lets one approved message architecture travel farther. When teams can adapt product recommendations, lifecycle emails, page modules, or nurture paths by segment, the economic question becomes whether relevance improves revenue efficiency enough to justify the software, data work, and governance. The 2.7x benchmark suggests that, at scale, it often does.[1]
Audience research sits between production and strategy. Its value shows up when AI speeds the synthesis of search behavior, customer interviews, reviews, sales-call themes, survey responses, competitive messaging, and first-party customer data. The output is not valuable because a model summarized it. It is valuable when the team uses that synthesis to choose segments, refine offers, write sharper briefs, or stop spending against weak assumptions.
The payback data supports the practical appeal of these workflows. Median AI marketing payback fell from 7.8 months in 2024 to 4.2 months in 2026, and content-heavy teams see payback in under 3 months.[1] That is the kind of timeline a manager can take into a quarterly planning conversation without asking leadership to wait a year for proof.
Why Video and Paid Social Creative Underperform
AI video is the category most likely to look better in a demo than in a production calendar. The generated clip may arrive quickly, but the surrounding work often remains: concept development, script review, legal and brand approval, editing, resizing, voiceover control, localization, usage rights review, and performance analysis. If those steps stay in place, the tool reduces only part of the cost structure.
That is why the 1.1x to 1.6x ROI range should not be dismissed as anti-video bias. It reflects a workflow where automation may improve ideation or versioning while leaving expensive human review intact.[1] In some teams, that is still useful. It is just not the same financial profile as turning one strong content brief into five usable assets before lunch.
Paid social creative has a separate problem. More variants do not automatically create more incremental revenue. If the variants are bland, repetitive, or visibly synthetic, they can accelerate creative fatigue instead of solving it. The research synthesis points to an observed 2026 industry trend in which Meta, TikTok, and Google ranking updates penalize obvious AI-generated ad creative, helping explain the low ROI of AI paid social tools.[1] That should be treated as an industry observation, not as proof of one simple platform rule that applies identically in every account.
For a paid media manager, the implication is narrow but important: do not count generated ad volume as value. Count incremental lift, lower cost per qualified action, longer creative durability, or reduced agency cost. If the AI tool produces more assets and the platform gives them less useful delivery, the extra output becomes noise.
The Spend Pressure Is Real, Which Makes Prioritization Less Optional
The reason this ranking matters in 2026 is that AI tool spend is no longer a small experiment hidden inside a software line item. The Gartner CMO Spend Survey 2026, cited in the Digital Applied synthesis, reports that 81% of CMOs expect AI tool spend to grow over the next 12 months, with a median planned increase of 47%.[1] TechnologyChecker reports that the median mid-market team now spends $3,400 per month on AI tools, up from $1,200 per month a year earlier.[2]
At that level, “we are experimenting” is not enough of an answer. A stack that includes writing, research, personalization, creative testing, image generation, video, and analytics tools can look reasonable one subscription at a time and still become hard to defend as a portfolio.
The companion question is covered in more detail in The AI for Sales and Marketing ROI Reality Check, which looks at broader adoption versus value capture. For this budget decision, the sharper move is to stop defending AI as a category and start defending or cutting individual use cases.
A Measurement Framework That Finance Can Read
The cleanest headline metric is MER: Marketing Efficiency Ratio, calculated as total revenue divided by total AI spend. The Digital Applied ROI framework recommends targeting 5.0x as the CFO-friendly benchmark.[3] That does not mean every individual tool must hit 5.0x in isolation, but it gives the portfolio a clear efficiency line.
MER = Total Revenue / Total AI SpendMER is useful because it avoids the trap of over-crediting whichever tool is easiest to narrate. A content tool may improve organic production, a personalization platform may lift lifecycle revenue, and an audience research tool may prevent wasted campaign spend. MER asks whether the overall AI marketing stack is improving revenue efficiency, not whether a vendor dashboard can claim influence.
For campaign-level proof, the same framework recommends incrementality testing with 10% holdout groups and triangulation across self-reported customer attribution, platform-reported metrics, and incrementality lift.[3] That matters because each source has a known weakness. Customers misremember. Platforms over-attribute. Lift tests take planning and volume. Together, they produce a more defensible answer than any one dashboard.
| Metric | What it answers | Where it helps |
|---|---|---|
| MER | Is the AI marketing stack improving revenue efficiency overall? | Quarterly budget review and portfolio-level decisions |
| Payback period | How many months before the tool or workflow earns back its cost? | Renewal decisions and new-tool approvals |
| Incrementality lift | Did the AI-assisted campaign create revenue or conversions that would not have happened anyway? | Paid media, lifecycle campaigns, personalization tests |
| Shadow ROI | Did the tool reduce operating costs even when direct revenue is hard to attribute? | Agency fees, production overhead, research time, content operations |
Shadow ROI deserves its own line rather than being quietly blended into revenue impact. The ROI framework notes that operational savings from agency fee reduction and overhead cuts of up to 10.8% can exceed direct revenue gains.[3] Those savings are real if finance can see the before-and-after cost base. They become less useful when they are used to pad a revenue claim.
A simple budget review can separate the two:
- Direct revenue impact: incremental conversions, incremental pipeline, incremental retained revenue, or improved revenue per visitor.
- Revenue efficiency: lower cost per qualified action, stronger MER, or better conversion from the same spend.
- Operational savings: fewer outsourced drafts, fewer research hours, lower editing load, reduced production overhead, or avoided agency fees.
- Review burden: additional legal, brand, data, creative, or platform-management work created by the tool.
That last line is where some AI business cases fall apart. A tool that saves 20 hours of drafting but creates 25 hours of review, cleanup, stakeholder alignment, or quality-control work has not improved the operating model. It has moved the bottleneck.
How to Prioritize the Next Quarter’s AI Marketing Budget
The first cut should be by workflow, not by vendor category. If the team already produces a steady volume of briefs, articles, landing pages, email variants, campaign concepts, sales enablement copy, or content refreshes, content drafting has the clearest economic case. The expected return should still be adjusted down for smaller teams, but it belongs in the funded group before flashier creative automation.
Personalization should be funded when the team has enough customer data, traffic, and lifecycle surface area to use it. A small list with weak segmentation will not magically become a high-return personalization program because an AI layer was added. A larger customer base with meaningful behavioral signals gives the tool more chances to create measurable lift.
Audience research should be funded when it changes decisions upstream. If the output only becomes a nicer-looking audience deck, the ROI will be hard to defend. If it changes keyword priorities, landing-page angles, nurture segmentation, sales enablement, offer framing, or paid media exclusions, it can earn its place without pretending to be a direct-response engine.
AI video belongs in a narrower test lane. Use it where the production stakes are contained: internal explainers, low-risk concepting, rough storyboards, localization experiments, or lightweight social formats that do not require heavy brand and legal review. Treat full production replacement as an assumption to prove, not a savings line to book in advance.
AI-generated paid social creative should be tested against holdouts and existing creative, not judged by the number of variants produced. The test should ask whether the AI-assisted creative improves incremental outcomes after platform delivery, fatigue, and conversion quality are accounted for. If it only lowers asset cost while weakening performance, the savings are not savings.

A practical funding order for Q2 2026 looks like this: fund content drafting, personalization, and audience research first; test AI video and paid social creative in controlled lanes; measure payback in months; and separate direct revenue from shadow ROI. Any AI marketing investment that cannot survive incrementality testing or a clear operational-savings calculation is a candidate for delay.
References
- AI Marketing Statistics 2026: 200+ Adoption Insights — Digital Applied
- AI in Marketing Statistics 2026 — TechnologyChecker
- Measuring AI Marketing ROI: Complete Framework Guide — Digital Applied

Comments
Join the discussion with an anonymous comment.